2020 BIAnalytics
Entersoft Business Suite® | Entersoft Expert® | Entersoft CRM® | Entersoft WMS®
Νέα χαρακτηριστικά και επεκτάσεις
Περιεχόμενα
- 1 Συνοπτική περιγραφή περιεχομένων
- 2 Νέο OLAP
- 2.1 Μενού OLAP
- 2.2 Παράμετροι OLAP
- 2.3 Συναφή OLAP
- 2.4 Μετρητές & διαστάσεις: Λίστα πεδίων πίνακα
- 2.5 OLAP & Πίνακες (Pivot Grids)
- 2.5.1 Ιδιότητες πίνακα
- 2.5.2 Drill down
- 2.5.3 Αποθήκευση και Ανάκληση Δεδομένων
- 2.5.4 Βασικές επιλογές επί μιας διάστασης
- 2.5.5 Δυναμικά φίλτρα
- 2.5.6 Ταξινόμηση δεδομένων
- 2.5.7 Επέκταση / Σύμπτυξη
- 2.5.8 Αντιγραφή (Copy)
- 2.5.9 Ιδιότητες πεδίου
- 2.5.10 Νέο πεδίο
- 2.5.11 Νέο πεδίο βάσει παράλληλης περιόδου
- 2.5.12 Νέο πεδίο επί συνόλου
- 2.5.13 Νέο πεδίο μετατροπής αξιών
- 2.5.14 Μορφοποίηση κελιών βάσει του περιεχομένου τους
- 3 Data Warehouse
- 4 Εργαλείο Οικονομικών Αναφορών σε EXCEL | Entersoft Excel Reporting
- 4.1 Βασικές λειτουργίες - Βήματα
- 4.1.1 Άνοιγμα αρχείων EXCEL εντός του Entersoft Business Suite
- 4.1.2 Ορισμός όψεων για τα προς χρήση δεδομένα
- 4.1.3 Καθορισμός EBS μεταβλητών και αθροιστών
- 4.1.4 Ενσωμάτωση μεταβλητών σε κελιά του EXCEL
- 4.1.5 Χρήση συναρτήσεων EXCEL για την επιθυμητή διαμόρφωση
- 4.1.6 Υπολογισμός μεταβλητών
- 4.1.7 Αποθήκευση – Ανάκτηση αρχείου και ανανέωση δεδομένων
- 4.2 Πλεονεκτήματα και Οφέλη
- 4.1 Βασικές λειτουργίες - Βήματα
- 5 EBS and Microsoft Power BI
- 6 Entersoft Analyzer
- 6.1 ES Analyzer Structure
- 6.2 Groups
- 6.3 MainMenu item
- 6.4 MainMenu Content item
- 6.5 ES UI Types
- 6.5.1 General
- 6.5.2 ESGrid
- 6.5.3 ESChart
- 6.5.3.1 ESChart Configuration
- 6.5.3.2 Box plot
- 6.5.3.3 Area
- 6.5.3.4 Bubble
- 6.5.3.5 Bullet
- 6.5.3.6 Donut
- 6.5.3.7 Funnel
- 6.5.3.8 Pie
- 6.5.3.9 Column, Bar, Line & Combined
- 6.5.3.10 Stacked Column or Bar
- 6.5.3.11 Polar
- 6.5.3.12 Radar
- 6.5.3.13 Range bar
- 6.5.3.14 Range area
- 6.5.3.15 Scatter
- 6.5.3.16 Sparklines
- 6.5.3.17 Waterfalls
- 6.5.4 ESTreemap
- 6.5.5 ESPivot
- 6.5.6 ESMap
- 6.5.7 ESGauge
- 6.5.8 ESCard
- 6.5.9 ESSankey
- 6.5.10 ESGantt
- 6.5.11 ESTimeline
- 6.5.12 ESCombo
- 6.6 System Information
- 6.7 Best Practices
- 6.8 Appendix A
Συνοπτική περιγραφή περιεχομένων
Νέο OLAP
- Αναβάθμιση των Contour κύβων στο νέο Entersoft OLAP
- Νέο UI με πληθώρα δυνατοτήτων για εναλλακτική παρουσίαση και εμβάθυνση στα δεδομένα
Data Warehouse
- Δυνατότητες για εγκατάσταση λύσεων Data Warehouse
- Έτοιμες OLAP αναφορές
Excel Reporting
- Entersoft Excel Reporting | Εργαλείο Οικονομικών Αναφορών σε Excel
Microsoft Power BI and EBS
Entersoft Analyzer
Νέο OLAP
Τα OLAP (On Line Analytical Processing) χρησιμοποιούνται σε πολλά σημεία του συστήματος όταν η μορφή της απαιτούμενης πληροφόρησης είναι «πολυδιάστατη». Κυρίως χρησιμοποιούνται στις επιλογές του μενού «Εικόνα Επιχείρησης». To OLAP αφορά την παρουσίαση και ανάλυση δεδομένων (μετρητών / metrics) ανεπτυγμένων σε πολλές ανεξάρτητες μεταξύ τους και ταυτόχρονα εικονιζόμενες ιεραρχικά «διαστάσεις».
Στα πλαίσια της έκδοσης 2020 του Entersoft framework δημιουργήθηκε και είναι διαθέσιμο εργαλείο για τη σχεδίαση και διαχείριση OLAP. Οι παλαιοί contour κύβοι αντικαταστάθηκαν. Ενσωματώθηκε νέο OLAP control. Το νέο OLAP
- παρέχει πληθώρα νέων χειριστικών δυνατοτήτων,
- εμπλουτίζει τις δυνατότητες απεικόνισης της πληροφορίας (ενσωμάτωση χρωματικών ενδείξεων, γραφημάτων, πολλαπλών τμημάτων ή tabs),
- απλοποιεί και επιταχύνει σε σημαντικό βαθμό τη δημιουργία ή συντήρηση ενός OLAP.

|
Τεχνικές πληροφορίες |
|---|---|
| Στο σημείο αυτό είναι σημαντικό να γίνει σαφές ότι η αναβάθμιση δεν αφορά μόνον το επίπεδο της παρουσίασης αλλά έχει επαναπροσεγγιστεί και η δομή τους εσωτερικά και στο σύστημα αρχείων. Σε περίπτωση ύπαρξης CS προαπαιτείται ο μετασχηματισμός αυτών μέσω εξειδικευμένου εργαλείου που παρέχεται με την 2020 έκδοση της εφαρμογής. |
Τα κύρια δομικά στοιχεία στην οθόνη ενός OLAP είναι
- η γραμμή εργαλείων - toolbar,
- η περιοχή δεξιά με
- τις παραμέτρους εκτέλεσης,
- τις συναφείς όψεις και
- τη διαμόρφωση διάταξης διαστάσεων και μετρήσεων
- η οριζόντια και η κάθετη περιοχή με τις διαστάσεις και
- το πλέγμα προβολής των δεδομένων

Μενού OLAP
Αρχικά, τα OLAPs διαθέτουν μενού μέσω του οποίου ο χρήστης μπορεί να προσθέσει κάποιο από αυτά στις συντομεύσεις, να κάνει επεξεργασία του OLAP ή να εξάγει τα δεδομένα, με όποια από τις διαθέσιμες επιλογές επιθυμεί, καθώς επίσης και να επηρεάσει τη διάταξη αυτού.
Πρόσβαση στην επεξεργασία OLAP
Στο μενού «Ενέργειες» παρέχεται πρόσβαση στην Επεξεργασία OLAP ή της Όψης. Η όποια μεταβολή στο ερώτημα βάσει του οποίου αντλούνται τα δεδομένα γίνεται μέσα από το εργαλείο Κατασκευής Όψεων (Scroller designer). Σημειώνεται ότι οι όψεις δεν αποτελούν αποκλειστική πηγή δεδομένων ενός OLAP. Υποστηρίζονται πλέον και SSAS (SQL Server Analysis Services). Τα SSAS αξιοποιούνται από τους οργανισμούς ως εργαλείο για την ανάλυση και τη νοηματοδότηση πληροφορίας που πιθανά είναι κατατετμημένη σε πολλές βάσεις δεδομένων ή σε ετερόκλιτες δομές αποθήκευσης δεδομένων.
Είναι σημαντικό να γίνει κατανοητό ότι τα OLAP υποστηρίζουν πλέον την ύπαρξη πολλών παράλληλων πινάκων ή και διαγραμμάτων. Αυτό πρακτικά σημαίνει ότι για ένα κοινό σύνολο δεδομένων υπάρχει η δυνατότητα να συνυπάρχουν στα πλαίσια του ίδιου OLAP πολλές παράλληλες παρουσιάσεις αυτών. Η ανάγκη παλαιότερα καλυπτόταν αποκλειστικά από τις εναλλακτικές διατάξεις.
Πλέον προσφέρονται νέες δυνατότητες και οι εναλλακτικοί τρόποι παρουσίασης μπορεί να εμφανίζονται σε διαφορετικές δεικτοσελίδες εντός του ενός OLAP που εμφανίζονται ταυτόχρονα (όπως για παράδειγμα στην επόμενη εικόνα) ή εναλλακτικά.

Εξαγωγή δεδομένων
Τα νέα OLAP υποστηρίζουν την εύκολη εξαγωγή δεδομένων στις ακόλουθες μορφές:
- Excel 97-2003 Workbook (XLS),
- Excel Workbook (XLSX),
- Hypertext Markup Language (HTML),
- Portable Document Format (PDF),
- Comma-separated values (CSV),
- Text file (txt).
Μετά την επιλογή της μορφής αρχείου στην οποία είναι επιθυμητή η εξαγωγή δεδομένων, εμφανίζεται διάλογος όπου ο χρήστης, στην ενότητα αρχείο:
- επιλέγει περιοχή και όνομα αρχείου,
- κατά πόσο επιθυμεί να ανοίξει το αρχείο στο τέλος της εξαγωγής
- αν είναι θεμιτό να εμφανιστούν και τα κριτήρια, δηλ. οι τιμές των παραμέτρων με τις οποίες εκτελέστηκε το OLAP
- αν επιθυμεί να συμπεριληφθούν τα υπόλοιπα περιγραφικά στοιχεία του OLAP (τίτλος, ημερομηνία, εταιρεία)

Στην ενότητα Πίνακας, ο χρήστης ορίζει αν οι τιμές ομαδοποίησης σε γραμμές ή/και στήλες θα είναι συμπληρωμένες ώστε, ειδικά στην περίπτωση εξαγωγής σε Excel αρχεία, να δίνουν αμεσότερα περεταίρω δυνατότητες διαχείρισης των δεδομένων καθώς και αν είναι θεμιτό να εμφανίζονται οι τίτλοι των δεδομένων ή μόνο τα δεδομένα.

- Τέλος, σε όποια μορφή έχει νόημα (π.χ. PDF), γίνεται αυτομάτως και σελιδοποίηση.
Ακολουθούν ενδεικτικά παραδείγματα εξαγωγής σε αρχεία XLSX, PDF, HTML.


Είναι σημαντικό να τονίσουμε πως στην περίπτωση που υπάρχουν πολλοί πίνακες (π.χ. σε διαφορετικά tabs) μέσα σε ένα OLAP, τότε κατά την εξαγωγή δεδομένων, εξάγονται όλοι οι πίνακες ανεξαιρέτως. Ειδικά στην περίπτωση εξαγωγής σε Excel, κάθε πίνακας εξάγεται σε διαφορετικό Sheet.

|
Προσοχή! |
|---|---|
| Σημειώνεται ότι αν η εξαγωγή γίνεται με σκοπό την περεταίρω επεξεργασία και μελέτη των δεδομένων, ενδεχομένως να είναι θεμιτό να αποφευχθούν τα merged cells, που προκύπτουν λόγω τίτλων, κριτηρίων κ.ο.κ.. Στην περίπτωση αυτή η εξαγωγή πιθανότατα να πρέπει να γίνει εξαιρώντας τα στοιχεία αυτά. Δηλαδή, έχοντας επιλέξει τα εξής: |

Διατάξεις
Η επόμενη επιλογή στο μενού αφορά τις εναλλακτικές διατάξεις των OLAP και τη διαχείρισή τους. Μέσω των επιλογών αυτού του μενού, ο χρήστης έχει τη δυνατότητα:

- Κατ’ αρχάς να επιλέξει μια διάταξη. Οι διαθέσιμες εναλλακτικές διατάξεις είναι ομαδοποιημένες σε CS (διατάξεις της συγκεκριμένης υλοποίησης ή του συγκεκριμένου σταθμού εργασίας) και ES (διατάξεις του προϊόντος).
- Να μετονομάσει ή να διαγράψει την τρέχουσα διάταξη, εφόσον αυτή δεν είναι η προκαθορισμένη.
- Να αποθηκεύσει μία νέα διάταξη με τις όποιες προσαρμογές στην περιοχή δεδομένων.
- Να αλλάξει τη σειρά εμφάνισης των διατάξεων στο μενού.

|
Σημείωση |
|---|---|
| Ο χρήστης ESDEV έχει δυνατότητα μετονομασίας, διαγραφής και αλλαγής της σειράς των προϊοντικών διατάξεων μόνο, ενώ οι υπόλοιποι χρήστες μπορούν να επέμβουν στις μη προϊοντικές διατάξεις. |

Το όνομα της τρέχουσας διάταξης εμφανίζεται πάντα στον τίτλο του παράθυρου. Στην περίπτωση της προκαθορισμένης διάταξης, στον τίτλο του παράθυρου εμφανίζεται το όνομα του OLAP.
Παράμετροι OLAP
Λόγω του ιδιαίτερου τρόπου παρουσίασης των δεδομένων και των αυξημένων αναγκών για εξοικονόμηση χώρου, από την γενιά εφαρμογών 2020 αποφασίστηκε οι παράμετροι εκτέλεσης να τοποθετηθούν κατακόρυφα στο δεξί τμήμα των OLAP. Κατά τα γνωστά, στην περιοχή των παραμέτρων καθορίζεται το εύρος των αποτελεσμάτων που θα παρουσιαστούν για περεταίρω μελέτη και ανάλυση στο OLAP. Μόλις συμπληρωθούν, πρέπει να επιλεγεί το πλήκτρο «Αποδοχή» ώστε να εμφανιστούν όσες εγγραφές ικανοποιούν τα κριτήρια. Οι χειρισμοί που ισχύουν στις διάφορες κατηγορίες κριτηρίων είναι πανομοιότυπα όπως στην περίπτωση των όψεων.
Στο σημείο αυτό κρίνεται σκόπιμο να υπενθυμίσουμε τη διαφοροποίηση στο κριτήριο χρονικού διαστήματος, όταν αυτό εκφράζεται από πεδίο «περιόδου». Σε αυτή την περίπτωση, σε ορισμένα OLAP που συνήθως έχουν τίτλο «συγκρίσεις κατ’ έτος και μήνα», δίνεται η δυνατότητα να συγκριθούν αυτόματα επιλεγμένες χρονικές περίοδοι, από ένα ειδικού τύπου διάλογο. Επιλέγει κανείς έτη και διαστήματα σύγκρισης, είτε συγκεκριμένα είτε σε σχέση με την τρέχουσα ημ/νία.
Η ανάγκη που εξυπηρετεί αυτή η δυνατότητα είναι να ζητάμε ΜΟΝΟ τα δεδομένα που μας ενδιαφέρουν π.χ. η σύγκριση του 2ου 3μήνου φέτος και πέρυσι να μην απαιτεί να ζητήσουμε όλα τα δεδομένα 2 χρήσεων, αλλά μόνο των συγκριμένων μηνών και από τις 2 χρήσεις.
Η περιοχή των κριτηρίων μπορεί να γίνει minimize, προκειμένου να εξοικονομηθεί επιπλέον χώρος για την παρουσίαση πληροφορίας, κάνοντας απλώς κλικ στο εικονίδιο  . Με τον ίδιο ακριβώς τρόπο μπορούν να επανεμφανιστούν τα κριτήρια, ανά πάσα στιγμή.


Επιπρόσθετα, στο panel των παραμέτρων είναι διαθέσιμο πλήκτρο  εμφάνισης σύνοψης των επιλεγμένων τιμών παραμέτρων. Στη σύνοψη υπάρχει, επίσης, η δυνατότητα αντιγραφής των παραμέτρων μέσω του πλήκτρου
  .
.
Στα νέα OLAP η ρύθμιση για την αυτόματη επανεκτέλεση είναι διαθέσιμη μέσω της όψης που αντλεί τα δεδομένα. Κατά την εκτέλεση ενός OLAP απεικονίζεται με τον γνωστό μας τρόπο: την προβολή αντίστροφης μέτρησης χρόνου στο πλήκτρο Αποδοχή

Συναφή OLAP
Τα συναφή OLAP εξελίχθηκαν και αναδεικνύονται μέσω του εξειδικευμένου panel στα δεξιά του κάθε OLAP, κάνοντας κλικ στο εικονίδιο  . Υπάρχει ενσωματωμένη η δυνατότητα αναζήτησης βάσει τίτλου, κωδικού ή και περιγραφής.
- Με κλικ σε ένα OLAP από τη λίστα, το τρέχον OLAP αντικαθίσταται από το επιλεγμένο.
- Με control + click το επιλεγμένο OLAP ανοίγει σε νέα δεικτοσελίδα.
Η δυνατότητα για άνοιγμα ενός συναφούς OLAP σε νέα δεικτοσελίδα παρέχεται (εκτός από το συνδυασμό control key + click) και μέσω του δεξί κλικ μενού επί ενός συναφούς OLAP. Επιπλέον στο μενού αυτό διατίθεται και η άμεση πρόσβαση στη διαμόρφωση του OLAP.

|
|
Τεχνικές πληροφορίες |
|---|---|
|
Επιπλέον, δίδεται η δυνατότητα απόκρυψης του panel των συναφών OLAP και μέσω της κλήσης (invoke) ενός OLAP. Συνολικά το invoke των OLAP διαμορφώνεται ως εξής: OLAPArea | OLAPID | DefaultValuesXml | AutoExecute|layoutID | ShowOLAPSelector By default, έχει οριστεί να είναι ορατό το συγκεκριμένο Panel (ShowOLAPSelector = True). Ορίζοντας την τιμή False στο συγκεκριμένο σημείο του cInvoke ενός OLAP, το Panel των Συναφών του OLAP δεν θα είναι πλέον ορατό / διαθέσιμο. Σημειώνεται ότι τα συναφή OLAP δεν είναι διαθέσιμα σε περίπτωση που ένα OLAP χρησιμοποιείται για την παρουσίαση και ανάλυση πληροφορίας στο Context μιας οντότητας (context OLAP). |
Μετρητές & διαστάσεις: Λίστα πεδίων πίνακα
H διαμόρφωση της διάταξης των μετρητών και των διαστάσεων ενός pivot grid είναι διαθέσιμη στο tab για την λίστα πεδίων με κλικ στο εικονίδιο  . Για να εμφανιστεί η λίστα του συγκεκριμένου εκάστοτε πίνακα - pivot grid, ο χρήστης θα πρέπει να επιλέξει (να κάνει κλικ πάνω) στον πίνακα (pivot grid). Αν ο πίνακας έχει ονοματιστεί (έχει οριστεί τίτλος στις ιδιότητες πίνακα), τότε εμφανίζεται πάνω από την λίστα και το όνομα που του έχει δοθεί. Αν έχει απενεργοποιηθεί η μετακίνηση πεδίων, η λίστα πεδίων εμφανίζεται ανενεργή (disabled).

- Στο πάνω μέρος εμφανίζονται τα πεδία δεδομένων ή διαστάσεις που είναι διαθέσιμα προς χρήση αλλά ο σχεδιαστής του OLAP έχει επιλέξει να μην συμμετέχουν στη διάταξη. Σε αυτήν την περιοχή θα δούμε και διαστάσεις για τις οποίες πιθανά επιλέξουμε να αποκρύψουμε (Δεξί κλικ μενού: Πεδίο / Απόκρυψη πεδίου)
- Η Περιοχή Φίλτρου (Filter area) εμπεριέχει τις διαστάσεις που είναι άμεσα διαθέσιμες προς χρήση αλλά στην συγκεκριμένη χρονική στιγμή δε συμμετέχουν σε κάποιον από τους δύο άξονες των γραμμών ή των στηλών.
- Η Περιοχή Γραμμών και η Περιοχή Στηλών (Row and Column area) αντίστοιχα περιλαμβάνουν τις διαστάσεις που συμμετέχουν στην προβολή δεδομένων.
- Τέλος, η Περιοχή Δεδομένων (Data area) περιλαμβάνει τα ποσοτικά εκείνα πεδία που παρουσιάζονται ανά τις επιλεγμένες διαστάσεις.
Η λίστα πεδίων υποστηρίζει drag & drop προκειμένου να διαμορφωθεί το layout του OLAP βάσει των εκάστοτε αναγκών. Παρέχει επίσης εναλλακτικούς τρόπους παρουσίασης των πεδίων μέσω του πλήκτρου  (προσαρμογή διάταξης λίστας πεδίων). Επιλέγοντας το πλήκτρο ενημέρωση, οι αλλαγές του χρήστη εφαρμόζονται στην τρέχουσα διάταξη του OLAP. Υπάρχει η επιλογή της μη άμεσης ενημέρωσης των όποιων μεταβολών, μέσω της ενεργοποίησης του σχετικού check box. Συνολικά, η παραπάνω διαχείριση είναι η αντίστοιχη με αυτή των pivot grids στο Microsoft Excel.
OLAP & Πίνακες (Pivot Grids)
Κάθε πίνακας περιλαμβάνει τις ακόλουθες περιοχές:
- Column area & Row area | Τις κάθετες και οριζόντιες διαστάσεις στις οποίες είναι αναπτυγμένα τα αποτελέσματα. Μπορεί κανείς να «σύρει» με drag & drop κάποια από αυτές έξω από τους άξονες ή επίσης, να μεταφέρει μια διάσταση από τον οριζόντιο στον κάθετο άξονα και αντίστροφα.
- Filter area | Τις διαθέσιμες (βάσει της σχεδίασης του OLAP) επιπλέον διαστάσεις. Μπορεί κανείς να «σύρει» με drag & drop κάποιες από αυτές στον οριζόντιο είτε στον κάθετο άξονα.
 Ιδιότητες πίνακα

Το αν ανά πίνακα επιτρέπεται ή όχι η επανατοποθέτηση των διαστάσεων από τον χρήστη, καθώς και μια σειρά άλλων συμπεριφορών, ορίζεται από τις Ιδιότητες του Πίνακα (Δεξί κλικ μενού: Ιδιότητες πίνακα). Στο σημείο αυτό μπορεί να οριστεί τίτλος πίνακα, ποιες περιοχές θα είναι ορατές, πόσα επίπεδα θα είναι by default ανοιγμένα κατά την εκτέλεση του OLAP, αν θα υπάρχουν σύνολα ανά στήλη ή και γραμμή, συνολικά ή όχι, ή αν είναι θεμιτό να εμφανίζονται σύνολα και στην περίπτωση που για όλες τις διαστάσεις προκύπτει μία μόνο γραμμή.
Drill down
Μία χρήσιμη δυνατότητα είναι αυτή της εμβάθυνσης -drill down- στα δεδομένα που διαμόρφωσαν το αποτέλεσμα των μετρητών για ένα συνδυασμό διαστάσεων. Για παράδειγμα, κάνοντας διπλό κλικ σε κάποια από τις μετρήσεις (επιλεγμένες στην εικόνα που ακολουθεί) του Ιανουαρίου 2019, για την οικογένεια δαπανών «Παραγωγή», θα εμφανιστεί λίστα με τις αναλυτικές εγγραφές που διαμόρφωσαν τις μετρήσεις, όπως αυτές τις επιστρέφει το ερώτημα στη Βάση Δεδομένων.

Στο grid που εμφανίζεται, δίδεται η δυνατότητα για πολλαπλή επιλογή κελιών γραμμών και αντιγραφή των δεδομένων (και των τίτλων, αυτόματα) και επικόλληση σε κάποιο άλλο σημείο ή και άλλη εφαρμογή (π.χ. Notepad, Excel).
Ακόμη, με δεξί κλικ στην περιοχή του footer του grid, δίδεται η δυνατότητα για εμφάνιση, ανά κολώνα, διαφόρων τύπων συνόλων (άθροισμα, πλήθος, μέσος όρος, ελάχιστο, μέγιστο, κ.ο.κ.), ανάλογα και με τον τύπο της εκάστοτε κολώνας (ανάλογα δηλ. αν έχει αριθμητικό / αξιακό περιεχόμενο ή κάποιο κείμενο). Υποστηρίζονται, επίσης, δυνατότητες ομαδοποίησης, φίλτρα σε κάθε κολώνα, μέσω του εικονιδίου  , και συνολική αναζήτηση. Οι όποιες επιλογές είναι προσωρινές και δεν αποθηκεύονται.

Αποθήκευση και Ανάκληση Δεδομένων
Μία άλλη ενδιαφέρουσα δυνατότητα είναι αυτή της αποθήκευσης και της ανάκλησης δεδομένων.
Η δυνατότητα αυτή μπορεί να φανεί ιδιαιτέρως χρήσιμη στην περίπτωση που ένα OLAP προϋποθέτει χρονοβόρα ανάκληση δεδομένων. Στην περίπτωση αυτή, τα δεδομένα υπό μελέτη μπορούν να αποθηκευτούν σε ένα .bin αρχείο και να ανακληθούν οποιαδήποτε στιγμή για περεταίρω μελέτη.
Και αυτή η δυνατότητα είναι διαθέσιμη από το δεξί κλικ μενού: Δεδομένα > Αποθήκευση και Δεδομένα > Ανάκληση.
Βασικές επιλογές επί μιας διάστασης
Στο νέο OLAP Control είναι διαθέσιμες μια σειρά από επιπρόσθετες χειριστικές δυνατότητες, που ενισχύουν τη δυναμική του εργαλείου ως προς τη διαχείρισή του και την απεικόνιση των δεδομένων. Μέσω του δεξί κλικ μενού επί μιας επικεφαλίδας διάστασης δίδονται οι δυνατότητες για:
- Best fit, όπου η το πλάτος της διάστασης προσαρμόζεται ώστε να φαίνεται το κείμενο όλων των συγκεκριμένων τιμών
- Εντολή μετακίνησης, της διάστασης:
- αριστερά ή δεξιά κατά μία θέση ή
- στην αρχή ή στο τέλος της σειράς των διαστάσεων
Δυναμικά φίλτρα
Μέσω του εικονιδίου μπορεί ο χρήστης να φιλτράρει συγκεκριμένες τιμές διαστάσεων από λίστα ή με απλές εκφράσεις σύγκρισης.

Ακόμη περισσότερο, μέσω της επιλογής Show filter, στο δεξί κλικ μενού επί της επικεφαλίδας διάστασης, εμφανίζεται ένας editor για πιο advanced διαμόρφωση εκφράσεων για φιλτράρισμα δεδομένων.
Τα δυναμικά φίλτρα, που έχουν εφαρμοστεί, εμφανίζονται στο κάτω μέρος του OLAP από όπου ο χρήστης μπορεί να τα αφαιρέσει ή να τα επεξεργαστεί περεταίρω.

Ταξινόμηση δεδομένων
Τα OLAP παρέχουν επίσης μια σειρά δυνατοτήτων ως προς την ταξινόμηση δεδομένων. Κατ’ αρχάς υπάρχει η δυνατότητα ταξινόμησης των γραμμών και των στηλών.
Για παράδειγμα, ας δούμε ένα συγκεκριμένο OLAP. Στο OLAP της επόμενης εικόνας υπάρχει μία διάσταση στις γραμμές, ο Προμηθευτής, και μία στις στήλες, η Περίοδος.

Με κλικ στο εικονίδιο  / δίπλα στον τίτλο του Προμηθευτή, οι τιμές της διάστασης ταξινομούνται κατά αύξουσα ή φθίνουσα σειρά, αντίστοιχα:

Η ταξινόμηση γραμμής και ταξινόμηση στήλης των παλαιών κύβων, έρχονται κοντά στο πλέγμα των δεδομένων και αποκτούν μεγαλύτερη σαφήνεια:

- Με δεξί κλικ επί μιας διάστασης στην περιοχή γραμμών: εμφανίζεται η δυνατότητα ταξινόμησης των διαστάσεων των στηλών βάσει των δεδομένων της τρέχουσας γραμμής. Η ταξινόμηση είναι by default αύξουσα, θεωρώντας το κενό ως μικρότερο οποιασδήποτε τιμής. Η επιλεγμένη διάσταση γραμμής στην περίπτωση αυτή αποκτά την ένδειξη:
 και στο δεξί κλικ μενού είναι ορατές οι συγκεκριμένες λεπτομέρειες της ταξινόμησης.

- Ακριβώς αντίστοιχα ισχύουν και για τις στήλες. Με δεξί κλικ επί μιας διάστασης στην περιοχή στηλών: εμφανίζεται η δυνατότητα ταξινόμησης των διαστάσεων των γραμμών βάσει των δεδομένων της τρέχουσας στήλης.

Επέκταση / Σύμπτυξη
Με απλό αριστερό mouse click στο εικονίδιο  της διάστασης γίνεται expand η συγκεκριμένη επιλεγμένη διάσταση. Με <ctrl+ αριστερό mouse click> στο εικονίδιο της διάστασης ενός επιπέδου γίνεται αυτόματα expand ή collapse, αναλόγως, το σύνολο των διαστάσεων αυτού του επιπέδου, μαζικά, και των διαστάσεων στα πιο αναλυτικά επίπεδα αυτού. Η δυνατότητα αυτή παρέχεται και στο δεξί κλικ μενού επί μίας διάστασης.

Αντιγραφή (Copy)
Μέσω του δεξί κλικ μενού στα κελιά των μετρήσεων και στις τιμές των διαστάσεων, είναι διαθέσιμη η δυνατότητα της αντιγραφής του κειμένου. Στα κελιά των μετρήσεων αντιγράφονται οι τιμές των επιλεγμένων κελιών, στις διαστάσεις η τιμή πάνω από την οποία έκανε κλικ.
Ιδιότητες πεδίου
Μέσω του δεξί κλικ μενού σε μία διάσταση ή σε ένα metric, παρέχεται πρόσβαση και στις Ιδιότητες πεδίου (Δεξί κλικ: Πεδίο > Ιδιότητες).

Μέσω του διαλόγου αυτού, ο χρήστης έχει τη δυνατότητα να ορίσει τον Τίτλο του πεδίου – διάσταση, να ορίσει τύπο μορφοποίησης (Ημερομηνιακό, Αριθμητικό ή άλλο) και, εφόσον απαιτείται, να προσδιορίσει συγκεκριμένη μορφοποίηση. Για παράδειγμα, σε ένα αριθμητικό πεδίο μπορεί να ορίσει μία μάσκα του τύπου: #,0.00.
Επιπρόσθετα από το σημείο αυτό δίδεται η δυνατότητα μια συγκεκριμένη διάσταση να διαφοροποιηθεί από τον γενικό κανόνα της (μη) εμφάνισης συνόλων - ανάλογα με το τι έχει οριστεί στις ιδιότητες πίνακα και να ορίσει αν είναι επιθυμητή η εμφάνιση ή η απόκρυψη συνόλων (check box: Αθροίσματα).
Νέο πεδίο
Ο Τύπος και η Περιοχή έχουν νόημα κατά την προσθήκη νέου πεδίου (Δεξί κλικ: Πεδίο > Νέο πεδίο). Ο χρήστης μπορεί να ορίσει τον τύπου του πεδίου και να επιλέξει σε ποια περιοχή του OLAP επιθυμεί να προστεθεί το νέο πεδίο (στην περίπτωση του Νέου Πεδίου, τα συγκεκριμένα ενεργοποιούνται και τίθενται στη διάθεση του χρήστη). Στο σημείο αυτό, παρέχεται επίσης η δυνατότητα ορισμού ad hoc έκφρασης μέσω του ακόλουθου διαλόγου:

Στην γενικότητά τους, οι εκφράσεις μπορεί να είναι αξιοσημείωτα πολύπλοκες. Παρόλα αυτά, ένα οποιοσδήποτε χρήστης, με βασική εκπαίδευση στη διαχείριση του νέου εργαλείου, μπορεί να διαμορφώσει, ad hoc, απλές εκφράσεις όπως μέσους όρους κ.α.
Ειδικά σε σχέση με τις διαστάσεις, ημερομηνιακές ή κειμένου συνήθως, υπάρχει η δυνατότητα προσθήκης εκφράσεων που αφορούν συμβολοσειρές όπως substring και concatenation. Ακόμη, σε ένα ημερομηνιακό πεδίο υπάρχει η δυνατότητα να απομονώσουμε τον μήνα, το έτος κ.ο.κ. μέσω των διαθέσιμων συναρτήσεων.
Η πληθώρα δυνατοτήτων που παρέχονται μέσω της ad hoc επεξεργασίας παραστάσεων, συνδυάζοντας λογικές εκφράσεις, μαθηματικές κλπ. συναρτήσεις είναι πραγματικά πολλές και ανοίγουν νέους ορίζοντες στον τρόπο που αντιμετωπίζονταν ως τώρα τα δεδομένα και τη μετουσίωσή τους σε ουσιαστική πληροφορία.
Νέο πεδίο βάσει παράλληλης περιόδου
Μέσω της επιλογής αυτής υπάρχει η δυνατότητα να προστεθεί ένα νέο metric βάσει ενός ήδη υπάρχοντος με προϋπόθεση μία διάσταση χρόνου και την ύπαρξη ιεραρχίας τουλάχιστον δύο επιπέδων στην περιοχή των γραμμών προκειμένου να επιτευχθεί ο μηδενισμός ανά τη μία εκ των δύο διαστάσεων.
Όπως φαίνεται στο παράδειγμα της εικόνας που ακολουθεί, το έτος έχει προστεθεί ως νέα πεδίο – διάσταση με χρήση έκφρασης:

Οι διαθέσιμες συναρτήσεις (ES Functions) είναι:
- Απόκλιση σε σχέση με την πρώτη τιμή
- Ποσοστιαία απόκλιση σε σχέση με την πρώτη τιμή
- Διαφορά
- Ποσοστιαία διαφορά
- Προοδευτικό άθροισμα
Και, στη συνέχεια, το προοδευτικό άθροισμα τζίρου ως νέο πεδίο βάσει παράλληλης περιόδου, με μηδενισμό ανά έτος:

Νέο πεδίο επί συνόλου
Μέσω αυτού του διαλόγου μπορούν να οριστούν μία σειρά ποσοστών επί του μερικού ή του τελικού συνόλου γραμμής ή στήλης ή όλων.

Στο ακόλουθο OLAP έχει προστεθεί επιπλέον πεδίο δεδομένων που υπολογίζει το ποσοστό συμμετοχής του Τζίρου της περιόδου για τη συγκεκριμένη Οικογένεια / Ομάδα / Κατηγορία είδους.

Επιλέγοντας τον ακόλουθο τύπο ποσοστού:

Νέο πεδίο μετατροπής αξιών
Η προϋπάρχουσα δυνατότητα ενσωματώθηκε στο συγκεκριμένο σημείο. Αφού επιλεγεί από τον διάλογο το επιθυμητό νόμισμα δημιουργείται νέο πεδίο από την επιλεγμένη μέτρηση. Η μετατροπή αξιών δεν είναι διαθέσιμη στα επί συνόλου πεδία και στα πεδία παράλληλης περιόδου. Κατά το φόρτωμα μιας διάταξης τα πεδία σε άλλο νόμισμα ανανεώνονται αυτόματα βάση της τρέχουσας ισοτιμίας.
Μορφοποίηση κελιών βάσει του περιεχομένου τους
Τα OLAP προσφέρουν πληθώρα εναλλακτικών δυνατοτήτων προκειμένου η πληροφορία που παρουσιάζεται στην περιοχή των δεδομένων να είναι πιο παραστατική, εύκολα αναγνώσιμη και διακριτή.
Είναι διαθέσιμες οι ακόλουθες επιλογές και κάθε μία από αυτές παρέχει ένα σύνολο δυνατότητων προκειμένου να καλύψει και τις πιο πολύπλοκες ανάγκες απεικόνισης - επισήμανσης. Οι επιλογές αυτές μπορούν να αξιοποιηθούν και συνδυαστικά. Οι όποιες επιλογές μορφοποίησης και επισήμανσης δεδομένων μπορούν να αποθηκευτούν σε διάταξη προκειμένου να επαναχρησιμοποιηθούν εύκολα.
Κανόνες επισήμανσης κελιών
Παράδειγμα χρωματισμού κελιών δεδομένων όταν το περιεχόμενό τους ανήκει σε ένα συγκεκριμένο εύρος.

Top / Bottom rules
Πρόκειται πιο advanced κανόνες επισήμανσης κελιών που το νέο OLAP παρέχει έτοιμους, προκειμένου να διευκολύνει την μελέτη αποτελεσμάτων. Για παράδειγμα, στο παρακάτω OLAP έχει επιλεγεί ένας συγκεκριμένος χρωματισμός για τις τιμές εκείνες του πλέγματος που ξεπερνούν το μέσο όρο:

Data bars
Αναλογική απεικόνιση των ποσών / ποσοτήτων της περιοχής δεδομένων με τη βοήθεια bars σε διάφορα χρώματα.

Χρωματικές κλίμακες
Παρέχεται ποικιλία από έτοιμες χρωματικές κλίμακες προκειμένου να εντοπιστούν εύκολα οι υψηλότερες – ενδιάμεσες - χαμηλότερες τιμές και να αποκτηθεί μια γενική αίσθηση για την κατανομή τους.

Σετ εικονιδίων
Αντίστοιχη πληροφορία με αυτή που παρέχουν οι χρωματικές κλίμακες, παρέχουν και τα σετ εικονιδίων.

Σημειώνεται ότι ανά πεδίο στην περιοχή δεδομένων μπορεί να χρησιμοποιηθεί διαφορετικός τρόπος μορφοποίησης. Για παράδειγμα:

Ακόμη, μπορεί να χρησιμοποιηθεί ένας συνδυασμός. Για παράδειγμα, στην επόμενη εικόνα έχει χρησιμοποιηθεί ένα σετ εικονιδίων για να είναι άμεσα ορατό ποιες αριθμητικές τιμές είναι πολύ χαμηλές, χαμηλές, ποιες μεσαίες και ποιες υψηλές. Επίσης έχει προστεθεί ένα Top / Bottom rule που απεικονίζει με πράσινο χρώμα φόντο τις αριθμητικές τιμές που ανήκουν στο 20% των υψηλότερων τιμών:

Διαχείριση κανόνων μορφοποίησης
Από το αντίστοιχο δεξί κλικ μενού, είναι ορατοί ανά metric οι κανόνες μορφοποίησης που έχουν οριστεί σε ένα OLAP, με δυνατότητα να εστιάσουμε στους κανόνες που έχουν οριστεί για ένα συγκεκριμένο metric στην περιοχή δεδομένων.
Από τον διάλογο αυτό δίδεται η δυνατότητα διαμόρφωσης custom κανόνων μορφοποίησης υπό συνθήκες (Conditional Formatting), και επεξεργασίας ή διαγραφής των υπαρχόντων.

Μέσω του διαλόγου αυτού, ο χρήστης επίσης μπορεί να αλλάξει το metric στο οποίο έχει εφαρμοστεί ένας κανόνας μορφοποίησης:

Μπορεί επίσης να αλλάξει το συνδυασμό (i) Διάσταση Γραμμής (σειρά) και (ii) Διάσταση Στήλης (στήλη) όπου εφαρμόζεται ο συγκεκριμένος κανόνας μορφοποίησης.

Από τον διάλογο αυτό δίδεται και η δυνατότητα δημιουργίας νέου κανόνα μορφοποίησης βάσει συνθηκών της επιλογής του χρήστη. Για παράδειγμα:


Είναι, ακόμη, σημαντικό να γίνει κατανοητό ότι οι κανόνες μορφοποίησης δεν εφαρμόζονται σε ένα metric με τρόπο οριζόντιο, δηλαδή ανεξάρτητα από τις διαστάσεις. Αντιθέτως, αφορούν διαστάσεις συγκεκριμένων επιπέδων.
Στο παράδειγμα λοιπόν με το συνδυασμό κανόνων μορφοποίησης για το metric του Τζίρου, την Οικογένεια είδους και την Περίοδο Πώλησης:
Αν γίνει expand η διάσταση της Οικογένειας στις ομάδες και τις κατηγορίες της, θα δούμε ότι οι κανόνες μορφοποίησης έχουν εφαρμοστεί μόνο στο επίπεδο της διάστασης της οικογένειας, όπως περιγράφεται και στο διάλογο διαχείρισης κανόνων μορφοποίησης.
Στην περίπτωση που είναι επιθυμητό να εφαρμόσουμε μια χρωματική ένδειξη ανεξάρτητα από μία συγκεκριμένη διάσταση, θα πρέπει να είναι κατανοητό ότι αυτό έχει νόημα για συγκεκριμένου τύπου ενδείξεις. Για παράδειγμα, αν επιλέξουμε την ίδια χρωματική ένδειξη για να δώσουμε έμφαση στις κορυφαίες 10 μετρήσεις ανά Οικογένεια ειδών, δεν συνιστάται να χρησιμοποιήσουμε την ίδια ένδειξη για τα κορυφαία 10 ανά ομάδα ειδών καθώς ενδέχεται να προκαλέσει σύγχυση στην εξαγωγή γρήγορων συμπερασμάτων από τον χρήστη. Τα νέα Entersoft OLAP προστατεύουν τον χρήστη από την αυτόματη εφαρμογή τέτοιων ενδείξεων σε οποιαδήποτε διάσταση αλλά, βέβαια, ο χρήστης έχει τη δυνατότητα παράκαμψης αυτού μέσω της χειροκίνητης αλλεπάλληλης επιλογής των ίδιων ρυθμίσεων για όλες τις διαστάσεις. Τα Entersoft OLAP επιτρέπουν την κατακόρυφη εφαρμογή τέτοιων ενδείξεων όταν αφορούν αυτόνομες, απόλυτες ενδείξεις. Για παράδειγμα: κόκκινο back color στα κελιά των μετρήσεων με τιμή <100 ανεξάρτητα διάστασης.
Δυνατότητες ελέγχου του εύρους εφαρμογής των διαφόρων ενδείξεων δίδονται μέσω του διαλόγου διαχείρισης κανόνων μορφοποίησης υπό συνθήκες, οπότε ως γραμμή ή/και ως στήλη ορίζουμε το «Οποιαδήποτε», η οποία επιλογή είναι διαθέσιμη εφόσον έχει νόημα.

Τα νέα OLAP παρέχουν επίσης δυνατότητες άμεσης διαγραφής κανόνων μορφοποίησης από το σχετικό δεξί κλικ μενού: Manage rules…
- Είτε όλων των κανόνων μορφοποίησης για όλα τα metrics
- Είτε όλων των κανόνων μορφοποίησης για το τρέχον metric
- Είτε όλων των κανόνων μορφοποίησης για το τρέχον metric και το συγκεκριμένο συνδυασμό οριζόντιων και κάθετων διαστάσεων (την «τομή»)
|
|
Προσοχή! |
|---|---|
| Στα πεδία βάσει παράλληλης περιόδου (=ESFunctions) ΔΕΝ υποστηρίζεται η χρήση data bars ή άλλων κανόνων μορφοποίησης κελιών βάσει του περιεχομένου τους. |
Οι διαφόρων τύπων χρωματικές ενδείξεις μπορούν να αποθηκευτούν σε διατάξεις από τον χρήστη.
Data Warehouse
Πλέον, εξαιτίας των γρήγορων ρυθμών που κινούμαστε και μέσω των νέων ψηφιακών δυνατοτήτων που έχουν δοθεί, ο όγκος των ψηφιακών δεδομένων έχει πολλαπλασιαστεί σε εκθετικό βαθμό για ορισμένους οργανισμούς.
Εξαιτίας αυτού, προέκυψε η ανάγκη δημιουργίας πολυδιάστατων βάσεων δεδομένων που χρησιμοποιούνται για τη δημιουργία αναφορών που αντανακλούν την εικόνα ενός οργανισμού. Οι βάσεις αυτές αποκαλούνται Data Warehouses και περιέχουν ακατέργαστα δεδομένα. Τα δεδομένα αυτά αντλούνται από transactional βάσεις δεδομένων που χρησιμοποιούνται στον υπολογισμό μετρήσεων δίνοντας ποιοτική και γρήγορη πληροφόρηση που πολλές φορές αποκαλύπτουν τάσεις μεγάλης σημασίας για τη λήψη αποφάσεων σε έναν οργανισμό. Σε αυτό το σημείο είναι σκόπιμο να σημειωθεί πως εξαιτίας του προϋπολογισμού μετρήσεων, η άντληση δεδομένων για μία αναφορά μπορεί να είναι από 40% έως και 60% γρηγορότερη.
Για τους οργανισμούς που επιθυμούν να διαχειριστούν το μεγάλο όγκο δεδομένων μέσω Data Warehouse, έχει δοθεί η δυνατότητα εγκατάστασης του μέσω συγκεκριμένων ενεργειών και με χρήση εξειδικευμένων εργαλείων.
Όλα αυτά περιγράφονται λεπτομερώς εντός του σχετικού εγχειριδίου με τίτλο «CSDataWarehouseConfigurationEN» που βρίσκεται διαθέσιμο στα ESBooks της εφαρμογής.
Αναφορές
Για όσους έχουν εγκατεστημένη μία τέτοια λύση, έχουν δημιουργηθεί -με τη χρήση του νέου OLAP εργαλείου- αναφορές βασισμένες στη σύνδεση μίας πολυδιάστατης βάσης δεδομένων.
Για τις συγκεκριμένες αναφορές, έχουν αξιοποιηθεί στο μέγιστο όλες οι δυνατότητες του OLAP, ώστε με μία ματιά να μπορεί να γίνει σύγκριση μεγεθών, έτσι ώστε ο χρήστης να οδηγείται εύκολα, γρήγορα και με ασφάλεια σε σωστά συμπεράσματα που θα τον βοηθήσουν στη λήψη στρατηγικών αποφάσεων.
Στις παραγράφους που ακολουθούν περιγράφονται οι διαθέσιμες αναφορές (Μενού > Εικόνα επιχείρησης > Data warehouse).
Ανάλυση πωλήσεων
Η συγκεκριμένη αναφορά δημιουργήθηκε για να δώσει άμεση και γρήγορη πληροφόρηση στον χρήστη σχετικά με τις πωλήσεις του οργανισμού. Αποτελείται από πολλαπλές δεικτοσελίδες και είναι οι εξής:

- Τρέχουσα εικόνα
- Απόκλιση τζίρου
- Κορυφαία είδη (20)
- Κορυφαίοι πελάτες (20)
- Ανάλυση ανά εμπορικό τομέα και δραστηριότητα
Ανάλυση κερδοφορίας
Η συγκεκριμένη αναφορά δημιουργήθηκε για να δώσει άμεση και γρήγορη πληροφόρηση στον χρήστη σχετικά με την κερδοφορία του οργανισμού. Αποτελείται από πολλαπλές δεικτοσελίδες και είναι οι εξής:
- Κερδοφορία ανά χρονική περίοδο
- Κορυφαία είδη (20)
- Ανάλυση ανά ιεραρχία είδους
- Ανάλυση ανά εμπορικό τομέα και δραστηριότητα

Ανάλυση λιανικής
Η συγκεκριμένη αναφορά δημιουργήθηκε για να δώσει άμεση και γρήγορη πληροφόρηση στον χρήστη σχετικά με τις λιανικές πωλήσεις του οργανισμού. Αποτελείται από πολλαπλές δεικτοσελίδες και είναι οι εξής:
- Ανάλυση υποκαταστημάτων
- Κορυφαία είδη (20)
- Δείκτες πελατών
- Ανάλυση ανά εβδομάδα και ημέρα
- Ανάλυση ιεραρχίας είδους

Ανάλυση κατά διαστάσεις αποθήκης
Η συγκεκριμένη αναφορά δημιουργήθηκε για να δώσει άμεση και γρήγορη πληροφόρηση στον χρήστη σχετικά με τις πωλήσεις αναλυμένες βάσει χρώματος και μεγέθους. Αποτελείται από τη δεικτοσελίδα: Ανάλυση κατά χρώμα και μέγεθος.
Σε αυτό το σημείο είναι σκόπιμο να αναφερθεί πως οι τιμές της διάστασης «Χρώμα» έρχονται από τον πίνακα «Ομάδα χρώματος» βάσει της αντιστοίχισης που έχει γίνει στον πίνακα Διαστάσεις αποθήκης > Χρώμα.
Εργαλείο Οικονομικών Αναφορών σε EXCEL | Entersoft Excel Reporting
To EXCEL αποτελεί για πολλές επιχειρήσεις ένα χρήσιμο εργαλείο για τα στελέχη των οικονομικών τμημάτων και των λογιστηρίων. Σε πολλές περιπτώσεις ακόμη, υπάρχουν διάφορα φύλλα εργασίας για την τήρηση δεδομένων και αναφορών, έξω από το επιχειρηματικό λογισμικό ενός οργανισμού. Το εργαλείο επιτρέπει να συνδυάσουμε αυτή τη χρησιμότητα του EXCEL, με πρωτογενή και έγκυρα στοιχεία από το Entersoft Business Suite.


Βασικές λειτουργίες - Βήματα
Πρόκειται για ένα πολύτιμο εργαλείο κατασκευής οικονομικών αναφορών με πρωτογενή στοιχεία από το Entersoft Business Suite. Όλες οι όψεις του EBS είναι διαθέσιμες. Το εργαλείο ενσωματώνει τις δυνατότητες που προσφέρει το MS Excel (εργαλεία, συναρτήσεις, γραφήματα) και παρέχει έτοιμα πρότυπα φύλλα εργασίας Excel για ακόμη πιο στοχευμένες αναφορές
Άνοιγμα αρχείων EXCEL εντός του Entersoft Business Suite
- Το σύστημα επιτρέπει από την επιλογή του Μενού «Εισαγωγή» την επιλογή του Excel που επιθυμεί ο χρήστης. Το σχετικό φύλλο εργασίας, ανοίγει στην οθόνη του χρήστη για περαιτέρω επεξεργασία. Σημειώνεται ότι είναι εφικτό να γίνει χρήση από πρότυπα αρχεία .xls, που ήδη περιέχουν κεφαλίδες, δομημένα κελιά ή άλλη μορφοποίηση
Ορισμός όψεων για τα προς χρήση δεδομένα
- Στο βήμα αυτό ορίζουμε τις σχετικές όψεις με επιλογή από τις διαθέσιμες περιοχές όψεων του EBS. Για παράδειγμα μπορούμε να επιλέξουμε την περιοχή «Λογαριασμοί Γενικής Λογιστικής» ή «Πάγια» για τα σχετικά δεδομένα των όψεων.
Καθορισμός EBS μεταβλητών και αθροιστών
- Από τις επιλεγμένες όψεις και τα διαθέσιμα πεδία, ο χρήστης πρέπει να ορίσει τις μεταβλητές και τους αθροιστές για τους αναγκαίους υπολογισμούς που θα γίνουν στο φύλλο εργασίας

Ενσωμάτωση μεταβλητών σε κελιά του EXCEL
- Με την επιλογή «Εισαγωγή/Ενημέρωση Μεταβλητής», ο χρήστης θα ενσωματώσει την μεταβλητή της επιλογής του σε συγκεκριμένο κελί του φύλλου εργασίας.
Χρήση συναρτήσεων EXCEL για την επιθυμητή διαμόρφωση
- Ο χρήστης έχει στη διάθεση του όλες τις γνωστές συναρτήσεις που προσφέρει το Excel, για να μπορεί να εκτελέσει σχετικές πράξεις μορφοποίησης και υπολογισμών, αξιοποιώντας τα πρωτογενή δεδομένα του Entersoft Business Suite.
Υπολογισμός μεταβλητών
- Με την χρήση της επιλογής «Επανυπολογισμός μεταβλητών φύλλου», η εφαρμογή εκτελεί τους σχετικούς υπολογισμούς και συμπληρώνει τα σχετικά κελιά των μεταβλητών ή αθροιστών και συναρτήσεων του χρήστη.
Αποθήκευση – Ανάκτηση αρχείου και ανανέωση δεδομένων
- Δίδεται η δυνατότητα για την αποθήκευση των αποτελεσμάτων του αρχείου και του ανοίγματος του, εκτός της σουίτας της Entersoft και μέσω του MS Excel σε τρίτους χρήστες για την μελέτη και αξιολόγηση των αποτελεσμάτων.
- Επιπλέον, σε μελλοντικό χρόνο, είναι εφικτό το ίδιο αρχείο, να ανακτηθεί εντός του Entersoft, για την ανανέωση και επικαιροποίηση των στοιχείων από τα πρωτογενή δεδομένα του συστήματος.
Πλεονεκτήματα και Οφέλη
- Αποδοτικότητα, με αξιοποίηση έτοιμων πρότυπων αρχείων
- Δημιουργία custom αναφορές με διαθέσιμες μεταβλητές από έγκυρα δεδομένα από το ERP
- Εύκολη και γρήγορη λειτουργικότητα με αποθήκευση των στοιχείων
- Επανυπολογισμός των λογιστικών φύλλων και δεικτών μέτρησης απόδοσης (KPIs)

EBS and Microsoft Power BI
The Entersoft Power BI Connector
The Entersoft Power BI Connector is a data connector for Microsoft Power BI that enables users to connect to the Entersoft Business Suit and access their data. It is available for use from the June 2019 update of Microsoft Power BI Desktop and latest.
The following steps are required in order to establish a connection to Entersoft Business Suite through Microsoft Power BI Desktop:
- Open Power BI Desktop and go to Home > GetData > Online Services, select ‘Entersoft Business Suite (Beta)’ and click connect.

- Click ‘sign in’ on the sign in screen

- Insert credentials and click allow:

- Click connect to see the Navigator screen and select the data set(s) you wish to use for designing your report(s).

Available Analytic Reports
The following five (5) analytic reports have been designed and developed:
- Financial Analytics
- Pipeline Analytics
- Retail Analytics
- Sales Analytics
- Service Analytics
The aforementioned reports are stored in the following directory: AppBin\ESPowerBI\EBS.
Financial Analytics
This report has been designed and developed using the Published BI Content of the ‘Financial’ Group and it has the following six (6) tabs:
- Financial results
- Revenue analysis
- Cost analysis
- Expenses budget trend
- Bank account balance
- DSO

Pipeline Analytics
This report has been designed and developed using the Published BI Content of the ‘Pipeline’ Group and it provides the following three (3) tabs:
- Pipeline health
- Closure analysis
- Competition analysis

Retail Analytics
This report has been designed and developed using the Published BI Content of the ‘Retail’ Group and it has the following three (3) tabs:
- Market Basket Analysis
- Turnover Comparison (Last 2 years)
- Daily (Last 2 weeks)
- Item Dimension Analysis (Last 2 years)

Sales Analytics
This report has been designed and developed using the Published BI Content of the ‘Sales’ Group and it has the following six (6) tabs:
- Sales budget trend
- Geospatial analysis
- Company dimension sales figures
- Item dimension sales figures
- Top 20 customers
- Top 20 items


Service Analytics
This report has been designed and developed using the Published BI Content of the ‘Service’ Group and it has the following eight (8) tabs:
- Analysis By Period
- Top Services
- Overdue service
- Complaints
- Company Dimension Analysis
- Customer Dimension Analysis
- Item Dimension Analysis
- Representative

Published BI Content
The BI Content is shown on the ‘Navigator’ screen after establishing the connection to the EBS. The content is presented in a list of available data sets. Specifically, it is a collection of numerous data sets which are grouped into five (5) groups based on their content; Financial, Pipeline, Retail, Sales and Service.
Architecture
The structure of the published BI content is defined in the ‘ESPowerBIDS’ JSON file (AppBin\ESWebAssets\PowerBI). This JSON file describes the available data sets. Each data set uses a specific data retrieval component, named Public Query.
Public Queries
To design and manage a Public Query you have to use the view designer. Firstly, you create the view and then through the ‘Publish’ action you create the related Public Query.
For detailed information about Public Query, please visit: Entersoft Public Queries
JSON file – ESPowerBIDS
The JSON file is formed by two (2) sections; Groups and MainMenu sections.

The “Groups” section is bounded by opening and closing square brackets ( [ ] ) and all objects between square brackets must be comma ( , ) separated. It corresponds to the groups of the data sets.
The “MainMenu” section is bounded by opening and closing square brackets ( [ ] ) and all objects between square brackets must be comma ( , ) separated. It corresponds to the data sets.

Create BI Content
Firstly, the ‘ESPowerBIDS’ JSON file should be copied from AppBin\ESWebAssets\PowerBI to AppBin\CSWebAssets\PowerBI and afterwards the JSON file copied to the CS folder can be edited.
New Group
To add a new Group, a new object must be added to the Groups section in the JSON file.
In between the opening and closing remarks of this section, the following script should be inserted and be configured:
Group Configuration
The Group object main properties and their value types are the following:
- AA
Holds number value and defines the sequence in which a group is shown on the sidebar menu.
- ID
Holds string value and it is recommended to be an abbreviation of the title.
- Title
Holds string value which corresponds to the title of the group.
New MainMenu
To add a new MainMenu item, copy and paste the following script between the opening and closing brackets ( [ ] ) of the MainMenu section.
MainMenu Configuration
The most important MainMenu object properties and their value types are the following:
- AA
Holds number value.
- ID
Holds string value and always begins with “PQ_” followed by the MainMenu AA, i.e. PQ_10000.GroupID
Holds string value and always is the Group’s ID that the MainMenu belongs to. For instance, the MainMenu above belongs to the Group "SalesContent" and this Group’s ID is "SalesContent".
- Title
Holds string value which corresponds to the title of the data set.
- esDef
- GroupID
- GroupID
Holds the area of the Public Query as string value.
- FilterID
- FilterID
Holds the Public Query name (namely, the view ID).
- NoPaged
- NoPaged
Always True
- Params
- Params
You can use this property to set default values for the parameters defined in the public query.

Refresh Power BI Content
In order to refresh the data of a Power BI dashboard/report you need to do the following:
- Publish analytic reports as described in the aforementioned section
- Set up Microsoft Power BI Gateway
- The procedure is described in the following page: https://docs.microsoft.com/en-us/power-bi/service-gateway-onprem
Entersoft Analyzer
ES Analyzer Structure
To begin with, ES Analyzer is formed by several json files. There is the master json file named ESAnalyzer_Premium.json and the ESAnalyzer_Premium folder (Application Folder\ESWebAssets). The master json file (ESAnalyzer_Premium.json) holds Groups and the related folder (ESAnalyzer_Premium) contains subfolders with other json files. These subfolders are used for managing easier the large number of json files. Their names are based on each Group’s ID. Finally, the json files stored in each subfolder refer to the MainMenu and the MainMenu content items. The json files are named after MainMenu item ID. It is recommended to follow this practice when naming your folders or json files. However, you can name them at your convenience.
- Groups correspond to the sidebar menu of ES Analyzer.
- MainMenu items correspond to the sidebar submenu
- MainMenu content items correspond to the content area of each MainMenu item.


Attention: If there are two MainMenu items with the same ID, then the last one (in alphabetical order) will prevail.
MainMenu and MainMenu content items use ESUITypes to manage the way data are displayed. Some ESUITypes use restricted structure of data. Currently, there are seven (7) UI (User Interface) types available; ESGrid, ESChart, ESTreemap, ESPivot, ESMap, ESGauge and ESCombo.
In the following pages, a brief description of Groups, MainMenu & MainMenu content items, and afterwards, ESUITypes are thoroughly presented along with the necessary user guidelines and examples.
Prerequisites
ESUITypes use a specific data retrieval component, named Public Query. To design and manage a Public Query you have to use the view designer. Firstly, you create the view and then through the ‘Publish’ action you create the related Public Query.
For detailed instructions for Public Query creation, please visit: Entersoft Public Queries
Attention! Data CANNOT be sorted, if you use SQL Additions and ‘Instead of SELECT’ option is activated. If data are not sorted then server pagination is not supported.
CSWebAssets folder creation. This is required in order to avoid replacement of files when upgrading to latest EBS version. After, CSWebAssets folder creation, the ESAnalyzer_Premium.json and the ESAnalyzer_Premium folder must be copied from ESWebAssets to CSWebAssets.
If the master json file ESAnalyzer_Premium.json is copied to CSWebAssets then the system searches for the related ESAnalyzer_Premium folder INSIDE CSWebAssets. Consequently, IT IS MANDATORY TO COPY BOTH the master json file ESAnalyzer_Premium.json AND the related ESAnalyzer_Premium folder to CSWebAssets.
Groups
All groups are saved to the “ESAnalyzer_Premium” json file (Application Folder\ESWebAssets). The “Groups” section is bounded by opening and closing square brackets ( [ ] ) and all objects between square brackets must be comma ( , ) separated. As previously mentioned, it corresponds to the sidebar menu of ES Analyzer Site as depicted below. Also, the ID of each Group refers to the related subfolder inside ESAnalyzer_Premium folder.

User Privileges
By default, in the “ESAnalyzer_Premium” json file the following six (6) groups are included and each group is related to a user group which could be used to deny access to a user of this group:
| ID | Description | EBS User Group Code |
|---|---|---|
| MGMT | Deny access to General management | DENY_ANALYZER_MGMT |
| FIN | Deny access to Financial management | DENY_ANALYZER_FIN |
| CML | Deny access to Commercial management | DENY_ANALYZER_CML |
| SVC | Deny access to Customer support | DENY_ANALYZER_SVC |
| SCLOG | Deny access to Supply chain management | DENY_ANALYZER_SCLOG |
| BUSENT | Deny access to Master entities | DENY_ANALYZER_BUSENT |
To deny access to a menu group to a specific user, the corresponding user group should be assigned to this user in the Entersoft Business Suite and the group disappears from the ES Analyzer side bar menu.
If any new group was added, then the corresponding EBS User group should be created. For instance, the group with title ‘General’ and ID ‘GNR’ was added to the json file, then the corresponding EBS User Group should be DENY_ANALYZER_GNR.

To assign a user group to a user open the Entersoft Business Suite and go to General \ User administration and select a user. Then insert the user group in the user groups list and refresh the application server.
Attention! The prefix of the group should always be DENY_ANALYZER_ and the suffix should always be the ES Analyzer Group ID.
New Group
To add a new Group, a new object must be added to the Groups section in the JSON file. In between the opening and closing remarks of this section, the following script should be inserted and be configured:

Group Configuration
The Group object main properties and their value types are the following:
- AA | Holds number value and defines the sequence in which a group is shown on the sidebar menu.
- ID | Holds string value and it is recommended to be an abbreviation of the title.
- Title | Holds an object value. The object properties get string values. Each property refers to the language in which the title has to be written, i.e. “en” refers to the English language, “ro” refers to the Romanian language, etc. In case of monolingual title, the corresponding language property of our interest must be filled out and all others should have an empty string.

Icon | Holds string value and refers to the icon depicted in front of the title. All available icons can be found on the following websites:
- Material Design Icons To replace the existing icon with another one from this website you have to click on the icon you wish, copy the icon’s title and keep the “mdi mdi-“ and replace the second part of the string. See the example below:
- Bootstrap Glyphicons | To replace the existing icon with another one from this website you have to open the drop down list of the selected icon and select “HTML Tag”. Then paste the copied tag to a notepad and select the string defined to “class” and paste it to the “icon” property. See the example below:

MainMenu item
Each MainMenu item is saved as a distinct json file inside the folder of the Group that it is bound to. The Group folder has the same name with the GroupID of MainMenu item and the json file name must be the same with its ID. MainMenu is bounded by opening and closing curly brackets ( { } ).

New MainMenu
To add a new MainMenu item, create a new json file inside the folder of the group you wish to be bound to. In the new json file insert and configure the following script:

MainMenu Configuration
The most important MainMenu object properties and their value types are the following:
- AA | Holds number value and defines the sequence in which a group is shown on the sidebar menu. It is recommended to use tens of thousands of the Group AA that the MainMenu belongs to. For instance, the script of the MainMenu item above belongs to the Group "BUSENT" and this Group’s AA is 1, so 1 x 10000 = 10000. In many cases, more than one MainMenus are related to a Group, so a hundred is added to the AA of the previous MainMenu related to the same Group. For example, the AA of the first MainMenu related to Group "BUSENT" is 10000, so the AA of the next MainMenu related to the same Group should be 10000 + 100 =10100. The AA of the following MainMenu related to the same Group should be 10100 + 100 =10200 and so forth.

- ID | Holds string value and always begins with “PQ_” followed by the MainMenu AA, i.e. PQ_10000.
- GroupID | Holds string value and always is the Group’s ID that the MainMenu belongs to. For instance, the MainMenu above belongs to the Group "BUSENT" and this Group’s ID is "BUSENT".

Title | Holds an object value. The object properties get string values. Each property refers to the language in which the title has to be written, i.e. “en” refers to the English language, “ro” refers to the Romanian language, etc. In case of monolingual title, the corresponding language properties of our interest must be filled out and all others should have an empty string.
Description | Holds string value.

ESUIType | Holds string value. There are seven (7) UI (User Interface) types available; ESGrid, ESChart, ESTreemap, ESPivot, ESMap, ESGauge and ESCombo.
esDef | The MainMenu Content is set to this property. MainMenu Content configuration is thoroughly described in the following pages.

MainMenu Content item
MainMenu Content items are stored in the same json file with the MainMenu item that it is related to. MainMenu Content is set to the MainMenu property “esDef”. This section of the JSON is depicted in the content area of ES Analyzer Site and is related to a MainMenu.

New MainMenu Content item
To add a new item to the MainMenu Content, a new object or an array object must be set to the MainMenu property “esDef” in the JSON file. The esDef value type depends on the defined MainMenu ESUIType. Only in case of esCombo UI type, an array object must be set to esDef. In any other case, only one object can be set to esDef. The array object values are bounded by opening and closing square brackets ( [ ] ) and all objects between square brackets must be comma ( , ) separated. There is no specific script to set to esDef, since it differs from UI type to type.
ES UI Types
At this time, there are eight (8) UI (User Interface) types available. Each one corresponds to a graphic representation of data retrieved from the Entersoftt Business Suite (EBS) system. To retrieve data, the use of Views and Public Queries is required. Firstly, a View must be designed and afterwards, it must be published in order to create the related Public Query. In the JSON file, only the Public Queries and their areas are used. In some UI types, views must have restricted structure and their column names must apply to specific terms.
Currently, the following ES UI types are available:
General
Parameter panel
All ES UI types, except of ESGauge, use parameter panel and by default it is collapsed. All parameters defined in every Public Query are shown in the parameter panel of the corresponding component.

Investigation parameters
You can make any parameter of a Public Query investigable by assigning a zoom table to this parameter in the related view or by assigning a custom view.
To assign a custom view to a parameter, you have to:
- If Public Query of the custom view does not exist, create the related Public Query.
- Go to the parameter and assign the property ‘Investigation PQ’. The value of the parameter must have the following syntax PublicQueryArea\PublicQuery\ColumnName
- PublicQueryArea
- Corresponds to the Public Query Area inside the ESPublicQueries folder
- PublicQuery
- Corresponds to the investigation Public Query
- ColumnName
- The column name of the Public Query that refers to the value that will be passed to the investigation parameter.

Show parameter value
In case you wish a parameter value of a Public Query to be always visible, even if the parameter panel is collapsed, go to the related view of the public query in the view designer and assign to this specific parameter the property ‘Show parameter’ as True.

Params Property
 This property is used to set default parameter values to every Public Query of every ES UI Type. The parameter can be either hidden or displayed in the parameter panel. Default parameter value could be set even if the ES UI Type does not have parameter panel. It is assigned right after the FlterID property of any object.
It holds an array object where the id property holds as a string the parameter id and the value property holds as a string the value.
Supported types of parameters
At the present moment, the supported types of parameters are the following:
- Date range
- List of values:
- Today - “ESDateRange(Day)”
- Until today – “ESDateRange(SpecificDate, #1753/01/01#, Day, 0)”
- From today – “ESDateRange(Day, 0, SpecificDate, #9999/01/01#)”
- Yesterday – “ESDateRange(Day, -1)”
- Until yesterday – “ESDateRange(SpecificDate, #1753/01/01#, Day, -1)”
- Tomorrow – “ESDateRange(Day, 1)”
- From tomorrow – “ESDateRange(Day, 1, SpecificDate, #9999/01/01#)”
- Current week – “ESDateRange(Week)”
- Previous week – “ESDateRange(Week, -1)”
- Next week – “ESDateRange(Week, 1)”
- Current month – “ESDateRange(Month)”
- From start of month – “ESDateRange(Month, 0, SpecificDate, #9999/01/01#)”
- Until the end of month – “ESDateRange(SpecificDate, #1753/01/01#, Month, 0)”
- Previous month – “ESDateRange(Month, -1)”
- From start of prev month – “ESDateRange(Month, -1, SpecificDate, #9999/01/01#)”
- Until the end of previous month – “ESDateRange(SpecificDate, #1753/01/01#, Month, -1)”
- Current quarter – “ESDateRange(Quarter)”
- Previous quarter – “ESDateRange(Quarter, -1)”
- Current semester – “ESDateRange(SixMonth)”
- Previous semester – “ESDateRange(SixMonth, -1)”
- This year – “ESDateRange(Year)”
- Last year – “ESDateRange(Year, -1)”
- String
- Date
- Boolean
- Integer
Global parameter panel
This type of parameter panel can be used in ESCombo UI type to group the parameters that the objects of the ESCombo have in common. For instance, two different objects use two different Public Queries, though they are filtered by the same type of parameter with the title ‘Cash account’ and its code is ‘CashAccountCode’. Therefore, instead of having two different parameter panels, one for each object, the parameter in common could be grouped into one global parameter. 
Global Parameter Panel Configuration
The Global Parameter Panel main properties and their value types are the following:
AutoExecute | Holds a Boolean value. Passes the parameter values and executes or not the Public Queries. The available options are true and false.
- esPanelOpen |
- status | Holds Boolean value. Expands or collapses the panel. The available options are true and false.
- Parameters | The parameter configuration options. It accepts an Array of parameters, each with its own configuration options.
- id | The id of the parameter. The value must be the same with the parameters’ code.
- aa | Holds number value and defines the sequence in which the parameter is shown.
- Caption | Holds an object value. The object properties get string values. Each property refers to the language in which the parameter caption has to be written, i.e. “en” refers to the English language, “ro” refers to the Romanian language etc. In case of monolingual parameter caption, the corresponding language property of our interest must be filled out and all others should have an empty string.
- controlType | Refers to the control type of the parameter. For detailed information, refer to Appendix A
- parameterType | Refers to the parameter type. For detailed information, refer to Appendix A
- multivalued | Holds Boolean value. Determines if the parameter can hold single or multiple values. The available options are true and false.
- visible | Holds Boolean value. Determines if the parameter will be visible. The available options are true and false.
- Required | Holds Boolean value. Determines if the parameter is required. The available options are true and false.
- defaultValues
- Value | Holds the default value of the parameter. The syntax is the same with the default values defined in the view designer.
- Tags | Holds the value assigned to the parameter in the tab ‘Parameters’ in ‘Properties’ field of view designer. To get the value of the properties field, just click in the field and press
 +
+  . After pasting the tag, you should replace single backslash ( \ ) with double backslash ( \\ ) e.g. "INVPQ:ESPQParams\CompanyBranch\Code" "INVPQ:ESPQParams\\CompanyBranch\\Code".


Attention! The global parameter panel feature is available from version 2.1.0 and latest.
ESGrid
This type of UI is used when data should be displayed in a grid. No restricted structure and terms required in the view.

ESGrid Configuration
The ESGrid UI type main properties and their value types are the following:
- GroupID | Holds the area of the Public Query as string value.
- FilterID | Holds the Public Query name (namely, the view ID).
- PQOptions |
- serverPaging | Holds Boolean value. Enables or disables server pagination. The available options are true and false. Attention! To avoid any delays or server limitations when large amount of data are going to be shown in the grid, it is highly recommended to set serverPaging as true.
- pageSize | Holds numeric value and corresponds to the number of items shown to each page in the grid.When large amount of data are going to be shown in the grid, it is highly recommended to set pageSize a reasonable number (i.e. avoid setting more than 60 items per page)
- AutoExecute | Holds a Boolean value. Executes or not the Public Query. The available options are true and false.
Grid Layout
The layout defined in the view designer is used by ES Analyzer to depict the corresponding grid. For instance, column width, total row, number format, etc. Currently, colors and state icons are not supported.
It is highly recommended to keep grids as simple as possible. For instance, try to show only the necessary columns and avoid giving too large header titles considering that the grid is accessed through mobile devices.
ESChart
There are several types of charts. Supported types: Area, Bar, Box plot, Bubble, Bullet, Donut, Funnel, Line, Pie, Polar, Radar, Range Bar, Scatter, Sparklines and Waterfall. In the following lines, a description of mandatory properties of each chart is provided. For further information you can visit: Telerik - Kendo UI Chart documentation and see the Charts Section.
ESChart Configuration
All of the chart types mentioned above must have the following properties.
Mandatory Common Properties
GroupID
Holds the area of the Public Query as string value.
FlterID
Holds the Public Query name (namely, the view ID).
UIOptions
Holds an object that contains all properties relative to the graphic representation of data.
- Series
type
Holds a string value that defines the chart type.
Area, Bar, Box plot, Bubble, Bullet, Donut, Funnel, Line, Pie, Polar, Radar, Range Bar, Scatter, Sparklines and Waterfall
Field
Holds a column name defined in the view designer. This column must always contain numerical values. Occasionally, this property is set in the array of Group property.
categoryField
Holds the column name defined in the view designer which contains categorical values.
- Legend
visible
Holds a Boolean value; true or false. Defines the legend visibility.
Position
Holds string value that defines the position of the legend. There are four (4) basic options; top, bottom, left and right.
- Tooltip
visible
Holds a Boolean value; true or false. Defines the tooltip visibility.
template
Holds string value: e.g. "template": "#= category #: #= value #"
Visit Telerik - Kendo UI Templates for further information about templates
Box plot

Area

Bubble

No restricted structure and terms required in the view.
Properties
UIOptions
- Series
Legend
- visible
Holds a Boolean value; true or false. Defines the legend visibility.
- Position
Holds string value that defines the position of the legend. There are four (4) basic options; top, bottom, left and right.
- Labels
- Template
Holds string value and must be the following: "template": "#= series.name #"
Group
- Field
Holds as string a column name which contains categorical values. All other data will be grouped by these categorical values.
xField
Holds string value. It refers to the X coordinate of the bubble, so it holds a column name with numerical values.
yField
Holds string value. It refers to the Y coordinate of the bubble, so it holds a column name with numerical values.
sizeField
Holds string value. It refers to the size (or Z value) of the bubble, so it holds a column name with numerical values.
- xAxis
labels
- format
Holds string value which defines the format of the label.
Title
Holds an object value. It corresponds to the x axis title of the chart. The object properties get string values. Each property refers to the language in which the title has to be written, i.e. “en” refers to the English language, “ro” refers to the Romanian language etc. In case of monolingual title, the corresponding language property of our interest must be filled out and all others should have an empty string.
- yAxis
labels
- format
Holds string value which defines the format of the label.
Name
Holds as string the column name which contains categorical values. It has been previously declared in the field of Series Group.
Title
Holds an object value. The object properties get string values. Each property refers to the language in which the title has to be written, i.e. “en” refers to the English language, “ro” refers to the Romanian language etc. In case of monolingual title, the corresponding language property of our interest must be filled out and all others should have an empty string.
Bullet

Donut

Funnel

Pie

No restricted structure and terms required in the view.
Properties
UIOptions
- Series
startAngle
The start angle (degrees) of the first pie segment.
axis
Holds the column name defined in the view designer, which contains the number of counting items.
Column, Bar, Line & Combined

No restricted structure and terms required in the view.
Properties
UIOptions
- Series
Holds array object. The array can hold multiple series (objects). In this case, multiple data will be depicted in multiple columns, or bars, or lines or a combination of them. The possible combinations could be bar – line or column – line. All series must contain the following:
type
Holds a string value that defines the chart type. The available options are column, bar and line.
legend
- visible
Holds a Boolean value; true or false. Defines the legend visibility.
- Position
Holds string value that defines the position of the legend. There are four (4) basic options; top, bottom, left and right.
- Labels
- Template
Holds string value and must be the following: "template": "#= series.title #"
axis
The name of the value axis to use. Holds the column name defined in the view designer. This column must always contain numerical values.
- valueAxis
Corresponds to the graphical representation of Υ axis in the chart.
visible
Holds a Boolean value; true or false. Defines the axis visibility.
name
Holds a column name defined in the view designer. This column must always contain numerical values.
title
Holds an object value. The object properties get string values. Each property refers to the language in which the title has to be written, i.e. “en” refers to the English language, “ro” refers to the Romanian language etc. In case of monolingual title, the corresponding language property of our interest must be filled out and all others should have an empty string.
- categoryAxis
Corresponds to the graphical representation of the X axis in the chart.
Categories
Holds a string value. Here, the column name which returns categorical values should be defined.
Labels
There are several properties to help the user manage the way categorical data are depicted, such as rotation and font.
The property rotation holds a numeric value which defines the angle of the categorical values. The property font holds as a string value the size of the categorical values in pixels.

axisCrossingValues
Category indices at which the value axes cross the category axis.

Stacked Column or Bar
The configuration of this UI type is exactly the same as a simple column or bar chart. Their configuration has been described before. The only difference is that the user have to add two (2) more properties; the group and the seriesDefaults. Those properties must be inserted right after the legend property inside UIOptions. In case of stacked column or bar chart the series property type has to be removed, since it is declared in seriesDefaults property.
- Group
- Field
Holds as string a column name which contains categorical values. All other data will be grouped by these categorical values.
- seriesDefaults
- type
Holds a string value that defines the chart type. In this case, column or bar.
- Stack
Holds a Boolean value; true or false.
 Polar
Polar

Radar

Range bar

Range area

Scatter

Sparklines

Waterfalls

ESTreemap
This type of UI is used when a hierarchy should be depicted as treemap. In this case, restricted structure and terms are required in this view. For instance, let us depict the item hierarchy as a treemap. In the view, items are grouped into two (2) groups; Family and Group. Each one of the columns with categorical values must be named as a1, a2, a3 and so forth, and the column with the numerical values must be always named as Figure.


ESTreemap Configuration
- AA
- Holds number value and defines the sequence in which the chart is shown.
- GroupID
- Holds the area of the Public Query as string value.
- FilterID
- Holds the Public Query name (namely, the view ID).
- UIOptions
- Type
- Holds a string value and defines the way data are depicted. There are three (3) available options; horizontal, vertical and squarified.
ESPivot
This type of UI is used when data should be depicted in a pivot chart. No restricted structure and terms required in the view.

ESPivot Configuration
- AA
- Holds number value and defines the sequence in which the chart is shown.
- GroupID
- Holds the area of the Public Query as string value.
- FilterID
- Holds the Public Query name (namely, the view ID).
- UIOptions
- EnableChart
Holds Boolean value. Shows or hides the chart. The available options are true and false.
autoBind
Holds Boolean value. If set to false the widget is not bound to the data source during initialization. In this case data binding will occur when the change event of the data source is fired.
cudeDef
Fields
dataField
Holds the column name defined in the view designer, which contains the data we want to be depicted.
Area
Holds the area where the data will be placed in the chart. The available options are row, column, filter and data.
- dataType
This field is not mandatory. It is used only when the dataField contains datetime data. In this case the datatype must be defined through this property.
GroupInterval
This field is not mandatory. It is used only when the dataField contains datetime data and we wish to group the measures by a specific time period. For instance, we wish to depict the measures in quarters. By setting this property to quarter the data will be grouped by quarter. The available options are all calendar periods.
- pivotOptions
- allowSortingBySummary
Holds Boolean value. Enables or disables sorting by summary. The available options are true and false.
allowSorting
Holds Boolean value. Enables or disables sorting. The available options are true and false.
allowFiltering
Holds Boolean value. Enables or disables filtering. The available options are true and false.
allowExpandAll
Holds Boolean value. Enables or disables expansion. The available options are true and false.
showBorders
Holds Boolean value. Shows or hides borders. The available options are true and false.
fieldChooser
enabled
Holds Boolean value. Enables or disables the field chooser. The available options are true and false.
export
enabled
Holds Boolean value. Enables or disables the exporting. The available options are true and false.
fieldPanel
showDataFields
Holds Boolean value. Shows or hides data fields. The available options are true and false.
showRowFields
Holds Boolean value. Shows or hides row fields. The available options are true and false.
showColumnFields
Holds Boolean value. Shows or hides column fields. The available options are true and false.
showFilterFields
Holds Boolean value. Shows or hides filter fields. The available options are true and false.
allowFieldDragging
Holds Boolean value. Enables or disables field dragging. The available options are true and false.
visible
Holds Boolean value. Shows or hides field panel. The available options are true and false.
ESMap
This type of UI is used when data should be depicted on geographical map. In this case, restricted structure and terms are required in this view. Since, data will be presented on geographical map, the view must return columns with the longitude and latitude. Also, the following columns required:

- GID | Expression column of GID type with the following script: “newID()”.
- esTempl | Expression column of String type with the following script: “@esTempl”
- esIcon | Expression column of string type with an empty string (‘’).
- esLabel | This column must contain the categorical values (i.e. region name).
- esTitle | This column must contain the numerical values (i.e. turnover).

ESMap Configuration
- GroupID
- Holds the area of the Public Query as string value.
- FilterID
- Holds the Public Query name (namely, the view ID).
- UIOptions
- Type
- Holds a string value and defines the way data are depicted. Currently, only bubble type is available.
- titleField
- Holds a string value and must be the column name that contains the categorical values (region names). Since specific terms are used, the column name is esLabel.
- valueField
- Holds a string value and must be the column name that contains the numerical values.
ESGauge
This type of UI is used when you want to inform the user about the current value of a measure in comparison with the minimum and maximum values or with any other values. In this case, restricted structure and terms are required in this view. The Public Query result set could contain one or multiple rows. If the result set contains multiple rows, then multiple gauge graphs are created.

- GTitle
- The title of a gauge graph.
- GScale
- The code of a system scale.
- GValue1, GValue2, … , GValueN
- The values of the measures.

ESGauge Configuration
- GroupID
- Holds the area of the Public Query as string value.
- FilterID
- Holds the Public Query name (namely, the view ID).
- UIOptions
- GType
- Mandatory property that holds a string value and defines the way data are depicted. Available values: radial, linear and arc
- title
- Refers to a string shown in each gauge graph title and it is concatenated with the GTitle.
- expandRows
- Holds Boolean value. Enables or disables the creation of multiple gauge graphs. The available options are true and false. If the result set contains multiple rows and the selected option is false, then a graph using data of the first row is created.
- gaugesPerRow
- Corresponds to the number of gauge graphs that will be shown in each row. The valid values are 1, 2, 3, 4, 6 and 12
- Labels
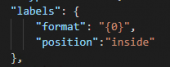 Refers to the values of the scale. In this section you define their format and their position.

- pointer
- The pointer configuration options. It accepts an Array of pointers, each with its own configuration options.
- PQOptions
- serverPaging
- Holds Boolean value. Enables or disables server pagination. The available options are true and false.
- Since the Public Query contains only one row, set tis property to false.
- AutoExecute
- Holds a Boolean value. Executes or not the Public Query. The available options are true and false.
ESCard
This UI type is used when you want to present information about an entity (e.g. customer, item,etc.) in a card. No restricted structure and terms required in the view, unless you want to show on a map the entity’s location. In this case, the columns of longitude and latitude must be named Longitude and Latitude, respectively.

ESCard Configuration
- GroupID
- Holds the area of the Public Query as string value.
- FilterID
- Holds the Public Query name (namely, the view ID).
- PQOptions
- serverPaging | Holds Boolean value. Enables or disables server pagination. The available options are true and false. Since the Public Query contains only one row, set tis property to false.
- AutoExecute | Holds a Boolean value. Executes or not the Public Query. The available options are true and false.
- pageSize | Holds numeric value and corresponds to the number of items shown to each page in the grid. When large amount of data are going to be shown in the grid, it is highly recommended to set pageSize a reasonable number (i.e. avoid setting more than 60 items per page)
- UIOptions
- HeaderField | Refers to the upper part of the card. Any column of the related public query can be assigned to this property.
- titleField | Refers to the title of the card.
- footerField | Refers to the footer of the card.
- tagField | This field is used in order to classify each card by adding border style color. The column assigned to this field can contain null values or values between 1 and 5. Each number corresponds to a color.
- null Light grey
- 1 Black
- 2 Blue
- 3 Green
- 4 Yellow
- 5 Red
- imageField | Refers to the image of the entity. Specifically, the column assigned to this field must hold the GID of table ES00Blob or the image url.

ESSankey
This UI type is used for visualization of material or cost flows. It shows the flow with arrows proportional to the flow measure.

ESSankey Configuration
- GroupID
- Holds the area of the Public Query as string value.
- FilterID
- Holds the Public Query name (namely, the view ID).
- PQOptions
- serverPaging
- Holds Boolean value. Enables or disables server pagination. The available options are true and false.
- Since the Public Query contains only one row, set tis property to false.
- AutoExecute
- Holds a Boolean value. Executes or not the Public Query. The available options are true and false.
- pageSize
- Holds numeric value and corresponds to the number of items shown to each page in the grid.
- When large amount of data are going to be shown in the grid, it is highly recommended to set pageSize a reasonable number (i.e. avoid setting more than 60 items per page)
- UIOptions
- HeaderField
- Refers to the upper part of the card. Any column of the related public query can be assigned to this property.
- titleField
- Refers to the title of the card.
- footerField
- Refers to the footer of the card.
ESGantt
This UI type is used for providing a graphical illustration of a schedule that helps to plan, coordinate and track specific tasks in a project.

ESGantt Configuration
By definition, the following three (3) Public Queries are used for visualizing data using this UI type:
- ProjectTaskResources
- The unique resources of the project tasks.
- ProjectTaskAssignments
- The resources assigned to each project task (resources by project task).
- ProjectTasks
- The project tasks that will be depicted. This public query uses the values of the two (2) aforementioned public queries.
- GroupID
- Holds the area of the ProjectTasks Public Query as string value (by definition, the value is ESWebManager).
- FilterID
- Holds the ProjectTasks Public Query name (by definition, the value is ProjectTasks).
- PQOptions
- serverPaging
- Holds Boolean value. Enables or disables server pagination. The available options are true and false.
- Since the Public Query contains only one row, set tis property to false.
- AutoExecute
- Holds a Boolean value. Executes or not the Public Query. The available options are true and false.
- pageSize
- Holds numeric value and corresponds to the number of items shown to each page in the grid.
- When large amount of data are going to be shown in the grid, it is highly recommended to set pageSize a reasonable number (i.e. avoid setting more than 60 items per page)
- UIOptions
If the following two (2) properties have NO values assigned to, then the system will search for the ProjectTaskResources & ProjectTaskAssignments public queries in the area assigned to the GroupID and then will execute them. If values are set to the properties, then those values will be used for searching and executing the public queries assigned to them.
- ProjectTaskResourcesPQ
- Holds a string comma separated value which is used for searching and executing the public query that applies to the required data set structure of ProjectTaskResources public query.
- Format: “PublicQueryArea , PublicQueryName”
- Where PublicQueryArea is the public query area, eg. ESTMtask
- and PublicQueryName is the public query name, eg. Resources.
- So, the value based on the example is “ESTMTask,Resources”.
- If you wish to execute another public query that is located in the area assigned to the GroupID, then the value format turns into “,Name” (eg. “,TaskResources”).
- If you wish to execute a public query with the name ProjectTaskResources, but its location differs from the GroupID, then the value format turns into “Area,” (eg. “ESTMTask,”).
- ProjectTaskAssignmentsPQ
- Holds a string comma separated value which is used for searching and executing the public query that applies to the required data set structure of ProjectTaskAssignments public query.
- Format: “PublicQueryArea , PublicQueryName”
- Where PublicQueryArea is the public query area, eg. ESTMtask
- and PublicQueryName is the public query name, eg. Assignments.
- So, the value based on the example is “ESTMTask,Assignments”.
- If you wish to execute another public query that is located in the area assigned to the GroupID, then the value format turns into “,Name” (eg. “,TaskAssignments”).
- If you wish to execute a public query with the name ProjectTaskAssignments, but its location differs from the GroupID, then the value format turns into “Area,” (eg. “ESTMTask,”).
ESTimeline
This UI type is used for visualizing processes (tasks, documents, etc.) in chronological order.

ESTimeline Configuration
This component is consisted of two (2) sections; Header and Details. Each one of them uses the related Public Query. For instance, in the trade account timeline scenario, the header section uses the ‘TimelineBusinessAccountInfo’ public query and the details section uses the ‘TimelineEvents’ public query. In the sales person timeline scenario, these two sections use the related header & details public queries.

- GroupID
- Holds the area of the Public Query that refers to the Details section as string value.
- FilterID
- Holds the title of the Public query that refers to the Details section.
- PQOptions
- serverPaging
- Holds Boolean value. Enables or disables server pagination. The available options are true and false.
- Since the Public Query contains only one row, set tis property to false.
- AutoExecute
- Holds a Boolean value. Executes or not the Public Query. The available options are true and false.
- pageSize
- Holds numeric value and corresponds to the number of items shown to each page in the grid.
- When large amount of data are going to be shown in the grid, it is highly recommended to set pageSize a reasonable number (i.e. avoid setting more than 60 items per page)
- UIOptions
- TimelineEntityInfoPQ
- Holds a string comma separated value which is used for searching and executing the public query that applies to the header of the timeline.
- Format: “PublicQueryArea , PublicQueryName”
- Where PublicQueryArea is the public query area, eg. ESWebManager
- and PublicQueryName is the public query name, eg. TimeLineBusinessAccountInfo.
- So, the value based on the example is “ESWebManager,TimeLineBusinessAccountInfo”.
ESCombo
This UI type is used when several of the UI types mentioned above must be combined and depicted in the same MainMenu content. In this case, an array must be assigned to MainMenu content “esDef” property, as shown in the figure. This array is multidimensional.
Every nested array corresponds to a subdivision of the MainMenu content area. The opening and closing square brackets ( [ ] ) of MainMenu content ‘esDef’ property can contain an array or arrays. In addition, each array of them can contain an object or more.
In the figure below, six (6) arrays are included in the esCombo. Only the first array contains two (2) objects; One combined and one funnel chart. An array can hold any type of object and any possible combination of them.


System Information
On this page, subsystems are enlisted and the related comments are shown next to each one of them. In case that an error occurs, it is reported by the system on “System information” page of the ES Analyzer. For instance, if there are two MainMenu items with the same ID or a MainMenu item is not related to a Group, then those events are reported.

Best Practices
- When you use Public Queries with large amount of data ALWAYS set serverPaging property as true and set a reasonable pageSize.
- Avoid using SQL Additions with the option ‘Instead of SELECT’ activated. In this case, server pagination is not supported.
- Avoid setting default parameters by using Params property in JSON file. Set them in Public Query.
- Use Params property when you need to assign the same Public Query to different ES UI Types and the Parameter is hidden.
- When you change any view ALWAYS publish it again to update the related Public Query.
- When you change your JSON file and a session is active on any device, refresh your browser to see changes.
- When you use a grid, avoid using too many columns and giving too large header titles considering that the grid is accessed through mobile devices.
Appendix A
Detailed information about parameter types and their control types used for configuring global parameter panels.
| Type | controlType | parameterType |
|---|---|---|
| String | 0 | System.String, mscorlib |
| String Range | 9 | Entersoft.Framework.Platform.ESString, QueryProcess |
| Decimal | 2 | System.String, mscorlib |
| Numeric Range | 8 | Entersoft.Framework.Platform.ESNumeric, QueryProcess |
| Date | 3 | System.DateTime, mscorlib |
| Date Range | 6 | Entersoft.Framework.Platform.ESDateRange, QueryProcess |
| Date Range Financial | 20 | Entersoft.Framework.Platform.ESDateRange, QueryProcess |
| Integer | 1 | System.String, mscorlib |
| GUID | 17 | System.Guid, mscorlib |
| Boolean | 7 | System.Boolean, mscorlib |
| FP Inventory | 10 | Entersoft.Framework.Platform.ESFiscalPeriodRange, QueryProcess |
| FP Normal | 11 | Entersoft.Framework.Platform.ESFiscalPeriodRange, QueryProcess |
| FP Closing | 12 | Entersoft.Framework.Platform.ESFiscalPeriodRange, QueryProcess |
| FP Normal Closing | 13 | Entersoft.Framework.Platform.ESFiscalPeriodRange, QueryProcess |
| FP Range Normal | 14 | Entersoft.Framework.Platform.ESFiscalPeriodRange, QueryProcess |
| FP Range Normal Closing | 15 | Entersoft.Framework.Platform.ESFiscalPeriodRange, QueryProcess |
| FP Compare | 16 | Entersoft.Framework.Platform.ESFPCompare, QueryProcess |
| Costing Period | 19 | Entersoft.Framework.Platform.ESCostingPeriodRange, QueryProcess |
| Hierarchical Task | 21 | System.String, mscorlib |
| Password | 22 | System.String, mscorlib |
