CS Data Warehouse Configuration EN
Table of = Required tools =
To begin with, in order to develop and deploy On-line analytical processing cubes the following must be installed:
- MS SQL Server Analysis Services (SSAS)
It is an analytical data engine used in decision support and business analytics and it provides enterprise-grade semantic data models for business reports.
Hereafter, the SQL Server Analysis Services will be called ‘SSAS’.
This engine is installed through the MS SQL Server Management Studio installation CD.
- MS SQL Server Integration Services (SSIS)
It is a platform for building enterprise-level data integration and data transformation solutions.
Hereafter, the SQL Server Analysis Services will be called ‘SSIS’.
This platform is also installed through the MS SQL Server Management Studio installation CD.
- MS SQL Server Data Tools (SSDT)
This tool is used for building, debugging, maintaining and refactoring databases or database projects.
Hereafter, the SQL Server Analysis Services will be called ‘SSDT’.
This tool could be found and downloaded for free by accessing the following URL: Download SQL Server Data Tools (SSDT)
Περιεχόμενα
SSAS Parametersts
Data Warehouse Objects
This data warehouse project is consisted of three (3) Cubes; SalesAnalytics, RetailSalesTransactionAnalytics, RetailItemDimensionAnalysis and numerous dimensions and measure groups.
SalesAnalytics cube
| Dimension | Attributes |
|---|---|
| Company | Company |
| Company Branch | Branch |
| Customer | Customer, Code, Name, Family, Industry |
| Customer Address | Region – Country – District – City, Address |
| Date Analysis | Year – Semester – Quarter – Month, Date, IsCurrent |
| Sales Person | Name |
| Item | Family – Group – Category – Subcategory – Item |
| Business Unit | Business unit |
| Business Activity | Business activity |
| Dimension 1 | Dimension 1 |
| Dimension 2 | Dimension 2 |
| Measure Group | Measures |
|---|---|
| Fact Key Figures | Turnover, Discounts, Sales Qty, Cost Of Goods Sold, Profit Margin[1], Profit Margin Percent1, Turnover Variance1, Turnover Variation Percent1, Sales Qty Variance1, Sales Qty Variation Percent1 |
| Transaction Key Figures | Transactions Count, Transactions Count Variance1, Transactions Count Variation Percent1 |
| Customer Key Figures | Customers Count, Customers Count Variance1, Customers Count Variation Percent1 |
| Item Key Figures | Items Count, Items Count Variance1, Items Count Variation Percent1 |
RetailSalesTransactionAnalytics cube
| Dimension | Attributes |
|---|---|
| Company | Company |
| Company Branch | Branch |
| Customer | Customer, Code, Name, Family, Industry |
| Customer Address | Region – Country – District – City, Address |
| Retail Date Analysis | Year – Semester – Quarter – Month – Week - Day, Date, IsCurrent |
| Item | Family – Group – Category – Subcategory – Item |
| Document | Document, Document Type, Anonymous customer, Credit Card Use, Time Zone |
| Business Unit | Business unit |
| Business Activity | Business activity |
| Dimension 1 | Dimension 1 |
| Dimension 2 | Dimension 2 |
| Measure Group | Measures |
|---|---|
| Fact Key Figures | Turnover, Discounts, Sales Qty, Cost Of Goods Sold, Turnover Variance[2], Average Turnover Per Transaction2, Sales Qty Variance2, Sales Qty Variation Percent2 |
| Transaction Key Figures | Transactions Count, Transactions Count Variance2, Transactions Count Variation Percent2, Credit Card Transaction Count2, Anonymous Customer Transaction Count2 |
| Customer Key Figures | Customers Count, Customers Count Variance2, Customers Count Variation Percent2, Anonymous Customer Count2, Anonymous Customer Turnover2, Anonymous Customer Turnover Percent2 |
| Item Key Figures | Items Count, Items Count Variance2, Items Count Variation Percent2, Item Family Count2, Item Group Count2, Item Category Count2, Item Subcategory Count2 |
RetailItemDimensionAnalysis cube
| Dimension | Attributes |
|---|---|
| Company | Company |
| Company Branch | Branch |
| Retail Date Analysis | Year – Semester – Quarter – Month – Week - Day, Date, IsCurrent |
| Retail Item | Family – Group – Category – Subcategory – Item |
| Item Main Color | Main color |
| Item Main Size | Main size |
| Measure Group | Measures |
|---|---|
| Fact Retail Item Entries | Turnover, Discounts, Sales Qty |
SQL Server Analysis Services (SSAS) Project
Each one of the previously mentioned cubes consists of several sets of partitions. The number of sets depends on the number of measure groups.
| Cube | Measure groups | Total number of partitions |
|---|---|---|
| SalesAnalytics | Fact Key Figures, Transaction Key Figures, Customer Key Figures, Item Key figures | 8 |
| RetailSalesTransactionAnalytics | Fact Key Figures, Transaction Key Figures, Customer Key Figures, Item Key figures | 8 |
| RetailItemDimensionAnalysis | Fact Retail Item Entries | 2 |
By default, each measure group has two partitions; ‘Facts up to 3 months before’ and ‘Recent facts’.
- Facts up to 3 months before
This partition has as starting point of the time frame that will be used for data retrieval the value of a parameter. This parameter value is stored in the column ‘Value’ of ES00SSASParameters table in the database and refers to a number of years. The ending point of the time frame is three months before the current date. For instance, let us suppose that the current date is 2019-06-13. If you wish to retrieve data from 2016, then the parameter value should be 3. Specifically, the partition will retrieve data with starting point 2016-01-01 and ending point 2019-03-13.
Recent facts
This partition uses as starting point of the time frame for data retrieval one day after the ending point of the ‘Facts up to 3 months before’ and it has no ending point. For example, if the ending point of ‘Facts up to 3 months before’ partition is 2019-03-13 then ‘Recent facts’ partition will retrieve data with starting point 2019-03-14.
 The starting point of the time frame of the ‘Facts up to 3 months before’ partition is ALWAYS the beginning of the year.
If one of the two partitions is changed, then the same partition in the other measure groups must be updated.
Data on a partition must not be the same with data on another partition.
- ==
 Set deployment server ==
- ==


After downloading the folder CSDataWarehouseProject and declaring the value of the ‘Value’ of ES00SSASParameters table in the database, go to SSAS and open the EntersoftDW.sln file.
To set the deployment server right-click on the file of the project in the Solution Explorer pane and go to Properties > Deployment and declare the server name and the database name.
Changing the Database name is NOT ALLOWED. The Database name should ALWAYS be CSDW.


Set Data Source
 To set data source connection, go to EntersoftDW > Data Sources > EBS_Server.ds and double-click on EBS_Server.ds in the Solution Explorer pane.
When the Data Source Designer opens, click on edit button to set the Server name, server log on credentials and the database in the ‘General’ tab.
By default, the ‘Use the service account’ option is selected in the ‘Impersonation Information’ tab. In this case, the Analysis Services object uses the security credentials associated with the Analysis Services service that manages the object.


SQL Server Integration Services (SSIS) Project
 The existence of Integration Services Catalog is mandatory in the MS SQL Server Management Studio. If there is no integration services catalog, you must create one by accessing the MS SQL Server Management Studio. Right-click on the Integration services catalogs file and select Create Catalog.
Set SQL Server Analysis Services (SSAS) Database connection
After creating the Integration Services Catalog, go to the CSDataWarehouseProject folder > SSIS and open the SSISEntersoftDW.sln file and set the SQL Server Analysis Services (SSAS) Database connection.
To set the SQL Server Analysis Services Database connection, go to SSISEntersoftDW > Connection Managers and double-click on conmgr file in the Solution Explorer pane.
When the Analysis Services Connection Manager opens, click on edit button to set the Server name.


Project deployment
To complete the overall process, the project must be deployed. On the SSDT Toolbar select Project > Deploy to open the deployment wizard. Click ‘Next’ in the Introduction pane to proceed.
Select “Project Deployment” option in Select the deployment model parameter.
Activate the “Project deployment file” option and click browse to go to …\CSDataWarehouseProject\SSIS\SSISEntersoftDW\bin\Development, select SSISEntersoftDW.ispac and click next.
Set Server name, click ‘Connect’ and browse to assign the integration catalog folder. In the following panes, click ‘Next’ and finally ‘Deploy’.


SQL Server Agent Job
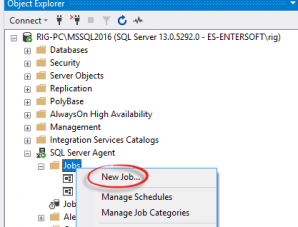
After deploying the SQL Server Integration Services Project, go to SQL Server Management Studio, browse SQL Server Agent. Right-click on ‘Jobs’ folder and select ‘New Job’.
Give a name to this job in ‘General’ tab
Go to ‘Steps’ tab and click ‘New…’. Name this step.
In the type parameter select ‘SQL Server Integration Services Package’, set the server name in the packages tab and select the SSIS package that was previously deployed.
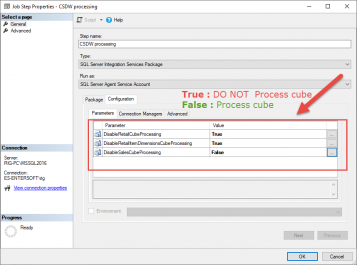
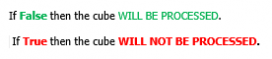 Go to the configuration tab and define which of the three (3) available cubes you wish to be processed by setting each parameter to True or False.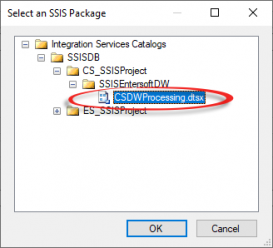


 Schedule the job based on your needs in order to process the selected cubes.


Accessing Cube through Excel
Open a new Excel sheet and go to Data > From other Sources and select From Analysis Services. On the pop-up screen declare the SQL Server Analysis Services name and then the cube. Define the type of data depiction (Pivot table or Pivot chart) and declare the measures and dimensions that you want to insert through the Pivot table or chart pane.


Accessing Cube through Power BI
Open Power BI and go to Get Data > Analysis Services. On the pop-up screen declare the SQL Server Analysis Services name (mandatory field) and the database name (optional field) and click ok. A ‘Navigator’ form is shown in order to select the cube you wish to use. After selecting a cube, its schema is shown in the Fields pane and you can design your charts by selecting one or more measures and dimensions.


Best Practices
