ESPowerBIAnalyticReports UserGuide
The Entersoft Power BI Connector is a data connector for Microsoft Power BI that enables users to connect to the Entersoft Business Suit and access their data. It is available for use from the June 2019 update of Microsoft Power BI Desktop and latest.
The following steps must be followed in order to establish a connection to Entersoft Business Suite through Microsoft Power BI Desktop:
 Open Power BI Desktop and go to Home > GetData > Online Services, select ‘Entersoft Business Suite (Beta)’ and click connect.
- Click ‘sign in’ on the sign in screen


Insert credentials and click allow:

Click connect to see the Navigator screen and select the data set(s) you wish to use for designing your report(s).


Available Analytic Reports
The following five (5) analytic reports have been designed and developed:
- Financial Analytics
- Pipeline Analytics
- Retail Analytics
- Sales Analytics
- Service Analytics
The aforementioned reports are stored in the following directory: AppBin\ESPowerBI\EBS.
Περιεχόμενα
Financial Analytics
 This report has been designed and developed using the Published BI Content of the ‘Financial’ Group and it has the following six (6) tabs:
- Financial results
- Revenue analysis
- Cost analysis
- Expenses budget trend
 Bank account balance
- DSO


Pipeline Analytics
This report has been designed and developed using the Published BI Content of the ‘Pipeline’ Group and it provides the following three (3) tabs:
- Pipeline health
- Closure analysis
- Competition analysis


Retail Analytics
This report has been designed and developed using the Published BI Content of the ‘Retail’ Group and it has the following three (3) tabs:
- Market Basket Analysis
- Turnover Comparison (Last 2 years)
- Daily (Last 2 weeks)
- Item Dimension Analysis (Last 2 years)


Sales Analytics
This report has been designed and developed using the Published BI Content of the ‘Sales’ Group and it has the following six (6) tabs:
- Sales budget trend
- Geospatial analysis
- Company dimension sales figures
- Item dimension sales figures
- Top 20 customers
- Top 20 items


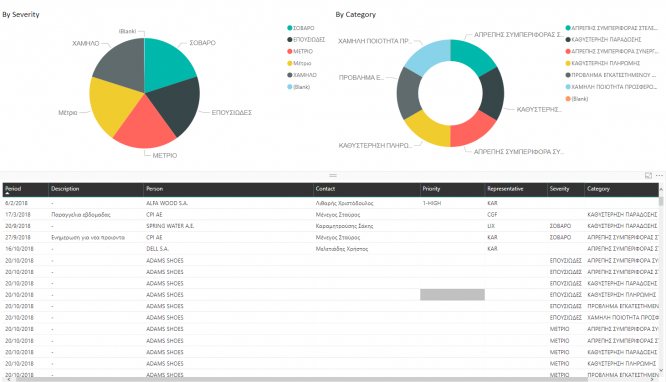
Service Analytics
This report has been designed and developed using the Published BI Content of the ‘Service’ Group and it has the following eight (8) tabs:
- Analysis By Period
- Top Services
- Overdue service
- Complaints
- Company Dimension Analysis
- Customer Dimension Analysis
- Item Dimension Analysis
 Representative

Published BI Content
The BI Content is shown on the ‘Navigator’ screen after establishing the connection to the EBS. The content is presented in a list of available data sets. Specifically, it is a collection of numerous data sets which are grouped into five (5) groups based on their content; Financial, Pipeline, Retail, Sales and Service.
Architecture
The structure of the published BI content is defined in the ‘ESPowerBIDS’ JSON file (AppBin\ESWebAssets\PowerBI). This JSON file describes the available data sets. Each data set uses a specific data retrieval component, named Public Query.
Public Queries
To design and manage a Public Query you have to use the view designer. Firstly, you create the view and then through the ‘Publish’ action you create the related Public Query.
For detailed information about Public Query, please visit: Entersoft Public Queries
 JSON file – ESPowerBIDS

 The JSON file is formed by two (2) sections; Groups and MainMenu sections.
The “Groups” section is bounded by opening and closing square brackets ( [ ] ) and all objects between square brackets must be comma ( , ) separated. It corresponds to the groups of the data sets.
The “MainMenu” section is bounded by opening and closing square brackets ( [ ] ) and all objects between square brackets must be comma ( , ) separated. It corresponds to the data sets.

Create BI Content
Firstly, the ‘ESPowerBIDS’ JSON file should be copied from AppBin\ESWebAssets\PowerBI to AppBin\CSWebAssets\PowerBI and afterwards the JSON file copied to the CS folder can be edited.
New Group
To add a new Group, a new object must be added to the Groups section in the JSON file.
In between the opening and closing remarks of this section, the following script should be inserted and be configured:
Group Configuration
The Group object main properties and their value types are the following:
- AA
Holds number value and defines the sequence in which a group is shown on the sidebar menu.
- ID
Holds string value and it is recommended to be an abbreviation of the title.
- Title
Holds string value which corresponds to the title of the group.
New MainMenu
To add a new MainMenu item, copy and paste the following script between the opening and closing brackets ( [ ] ) of the MainMenu section.
MainMenu Configuration
The most important MainMenu object properties and their value types are the following:
- AA
Holds number value.
- ID
Holds string value and always begins with “PQ_” followed by the MainMenu AA, i.e. PQ_10000.
- GroupID
 Holds string value and always is the Group’s ID that the MainMenu belongs to. For instance, the MainMenu above belongs to the Group "SalesContent" and this Group’s ID is "SalesContent".
- Title
Holds string value which corresponds to the title of the data set.
- esDef
- GroupID
Holds the area of the Public Query as string value.
- FilterID
Holds the Public Query name (namely, the view ID).
- NoPaged
Always True
- Params
You can use this property to set default values for the parameters defined in the public query.
Refresh Power BI Content
In order to refresh the data of a Power BI dashboard/report you need to do the following:
- Publish analytic reports as described in the aforementioned section
- Set up Microsoft Power BI Gateway
The procedure is described in the following page: https://docs.microsoft.com/en-us/power-bi/service-gateway-onprem
