EBS - Intro EN
Operating Applications Environment
Entersoft Business Suite® | Entersoft Expert® | Entersoft CRM®
Περιεχόμενα
- 1 Reference To Sub-Systems
- 2 Main Concepts
- 3 Work Environment
- 4 Data Management Screens (Sites)
- 5 Lists Of Data Display (Scrollers)
- 6 Financial Data Reports (ΒΙΤs)
- 7 Business Flow Charts
- 8 Cubes Data Analysis
- 9 Calendars
- 10 Attachments Management
- 11 Keyboard Operation
Reference To Sub-Systems
The system consists from applications that manage a number of sub-systems through which the total of business processes is served.
The data are monitored to one or more Data Bases (SQL Server).
The connection logic, of operation and cooperation between data and applications, but also the communication logic with the user is either embodied to the system (compulsory) or is separately described and designed for each installation.
The main functional areas (which are separated to others) where ENTERSOFT Business Suite is divided, are illustrated to the scheme:

M.I.S. Management Information with all sub-systems data combination.
C.R.M. Relations with customers and generally with the trade accounts and salespersons and groups activities to Sales Departments monitoring. Analytical and quality data for evaluation and control, for competition and critical factors. Daily personal and group sales action plans.
Operations of Marketing departments (programs, Campaigns, events, massive actions, etc). Integration with call center
Cycle of customers service provided to services departments (requests, complaints, typical errors, repair actions, queues per technician). Service contracts management with terms, ρήτρες, Response time, rules, guarantees etc. (SLAs).
Subscriptions Sub-system & automated periodic invoicing based on models.
Project Management Programming and tasks management in projects terms and theirs progress as well as the total of transits, payments or other financial facts. Budget and costing. Projects hierarchies. Projects management to project contracts, expenses estimation, advance payments etc.
Sales/Distributions Sales Processes Quoting, Delivery, Invoicing (sales orders, stock reservation, loading-control- order routing, delivery, invoicing, back orders). Up selling-cross selling processes. Invoicing and discount policies, gifts-offers, return policies, discounts origin, additional charges, automatic rebates based on agreements etc.
Retail Sale, Loyalty cards sub-system, Credit Cards, Coupons, Gift-cheques, Prepaid cards, Advance payments, Purchases rights (credit notes), Receipt electronic signature, Remoting-Off line sites and synchronization, Agreement of cash register machines with Z, Summarized day posting-analytical warehouse update.
Purchases/Supplies Supplies processes, Suppliers and prices investigation, suppliers evaluation, offers comparison, lead times monitoring, goods receipt processes, Imports from Foreign Country, Import to transit place. Programs of orders proposal based on the shortfalls or based on sales.
Inventories/Stock Items Processes of items management, control of expected items, etc, stock items allocation processes to branches, physical Inventory, corrections, transits, consignments, bonds, third parties warehouses, , stock valuation with all methods. BOMs, colors, sizes (season, sortiments), serial numbers, set and Assemblies.
Production Technical Specifications, Production orders , phases, control of raw materials adequacy, concentrated consumptions, OEM, budgeted and actual cost, cost analysis per cost factor
Budget Budget setting Tools / Revenue and expenses to “sheets” based on past data, scenarios, revisions, budgets to different currencies, tools of automatic dynamic review and budget cover control depending on the categorizations that each budget sheet monitors.
Financial Management Accounting, Allocations to other Chart of accounts, validated books, branches books, Balance sheet Automatic closing, Cash and Cash Equivalents, Banks, Exchange rates and currencies, Notes, Credit control processes Trade Accounts Ageing of Accounts, Cash flow Forecast, Fixed assets registry, Taxes, VAT, Withholdings & Payment, Debtors and Creditors, Expenses, Costing of imports from abroad, Tools of Accounting agreement with other sub-systems
For All sub-systems is provided in bigger or smaller degree, a ready parameterized proposal where based on this proposal the trained staff of ENTERSOFT will continue to the next «parameterization levels» in order the final system operation to be the optimal for the needs of the installation.

Main Concepts
Business Structures
Applications communicate with multiple Data Bases and manage multiple business entities of each base, for instance:
Group of companies
Companies
Branches
Warehouses
Warehouses positions
Business Units
Company activities
Sales areas
Users Groups – Working Positions
Users
Persons/Contacts and Persons Roles
Customers and Suppliers
Relations between persons/trade accounts
«System company» is the main concept, defines a number of data regarding a particular «company» (TRN), a Legal entity for which financial data (transactions, customers, cash, warehouses etc.) are autonomous and independently from other companies that may be monitored from the system.
Some of the above entities are COMMON and AVAILABLE to all «system companies». For instance, the total of the contacts – persons that we know and enter to the system is available to all “companies”. In this way, a 2 companies group has common contacts catalogue in order the «demographic» data to be ONLY ONCE entered. On the other hand, «customersς» are registers – accounts connected with (common) persons, but are separated per company when autonomous financial data per company, exist.
To all sizes, entities, financial or business facts range that system manages, are kept 6 «horizontal» dimensions of company information, for which the available reporting is provided:
Sub-System
Business Unit
Activity
Project
2 user defined dimensions
The Company and its sub-divisions
In each Data Base, companies and its “physical divisions” are illustrated to the following scheme:


Companies
In each Base are kept all companies data. This allows consolidated financial data, statistics and comparative data to be easier taken. The system recognizes the «intercompany» transactions. While it provides processes of automatic entries accomplishment, (e.g. sale from company “A” to company “B” as entry to A, to automatically occur purchase to “B” company data), at the same time, these entries are exempted from consolidated results reports.
Branches & Warehouses
Each company consists from the HEAD OFFICE and other ADR/SES-BRA/ES. These may be Warehouses or to have more than one Warehouses.
Warehouses may belong to the company or to be “areas” that goods belonging to third parties are kept, such as Service areas. It may also be areas in Third parties installations, where a company’s products are placed, such as, to Exhibitions or samples for test, or merchandises for repair from others or with OEM areas.
User groups (roles) and users
Each user belongs to a number of users groups where “roles” are developed, the “positions” of different system users.
Each user has access to particular system companies and their branches. For intervene to significant fields or particular processes use, is kept users actions history log.
Each users group has access to particular system operations, reports, processes and workflows, issue and particular documents use and sales tasks types, etc.
Fiscal Year Concept
The FISCAL YEAR of one company is defined from the accounting books. It may be Calendar (1/1-31/12 each year) or Interim (e.g. 1/7-30/6). In each Data Base and to data sub-total concerning a company, are kept all Fiscal Years data that serve all financial reports. This allows the easy and automatic comparison of years, months, “comparative” days etc, the easy navigation to transactions history log without the need of company and data base environment switch and finally allows the full and clear monitoring of “longitudinal” processes, such as of an offer an event etc.
The following scheme illustrates the structure of this entity:

Each Fiscal Year is autonomous as to all of her financial data from any previous or next and is divided to periods. In Greece, the periods are calendar months, for the needs of tax and other reports that are always monthly taken. The «period» defines the keeping of financial data (the data PER period are provided to tables).
The «period» to the system may be:

Inventory, are inserted the totals of the previous fiscal Year (for the need of fiscal years “Independent results)
Standard, are inserted all daily entries of all sub-systems
Closing, are inserted the entries that accounting departments are entitled to undertake concerning Fiscal year closing, until Balance Sheet closing (corrective entries, depreciations, Exchange differences, etc.) and where balance sheet closing entries are inserted. This is balance sheet and results account configuration, transactions sub-totals that the system SEPARATELY keeps and provides to particular reports columns making fiscal year accounting tasks and related controls, easier.
Persons and Contacts
The Persons is a central catalogue off all companies and all companies’ managers and any physical persons that the organization is interested to. Is an “agenda” an index. Company’s employees system users, Banks, Cheques guarantors and issuers, constructors and representatives, merchandises receivers, customers, suppliers, the carriers companies, the system Company/ies by itself, are all persons.
For each person, identity data are only kept once, relations with other persons, any Bank accounts (that are later used from different sub-systems for money orders) the addresses that we know about this person (chain branches, home addresses), the photo or logo and a big number of informative data.

For one person («common entity») may occur different “roles” some of which consist (and must consist) separate “financial entity” (or “register”).
An example of physical person roles is “system user” and “salesperson” at the same time. The personal-demographic data are kept to the person ONCE.
An example of a Legal Entity roles that at the same time also constitute separate financial entities, is customer AND supplier or customer of OUR TWO companies. In both cases the identity data are kept ONCE to the “person” whereas TWO “financial entities” (registers” are opened for the monitoring of financial transactions. The system provides “CONSOLIDATED financial overview of the person (the amount a customer owes to more than one of our companies, what is the debts deference to a supplier that is also a customer etc.)
The relations between persons give a big information range, for example:

The position that someone has within a company
The employees,
Candidate relationship with existing customers,
The shareholder relationship, family relationships,
People who take decisions affecting agencies,
The Definition of addresses-branches in Persons, gives further separation of the register of the related "financial entities" per branch (e.g. Customer-chain register or Pending orders PER branch of his)
Items and Items Classes
Catalogue Items is a central catalogue of all items that produces or the company/es are monitored trades, other and competitors items, market items that may be asked instead of ours, items spare parts or market items for which our items, constitute compatible spare parts or parts or accessories, items from suppliers pricelists that are not ordered if there is a customer has not order them etc.
For each catalogue item are kept:
Some informative data useful for grouping and selection-“filtering”
Indicative sales prices (wholesale, retail) and cost
Characteristics and properties that are designed– added to installation level depending on the needs e.g. For technical characteristics properties, values limits, physical dimensions etc.
Relations with other items (equivalent, accessories, suggested for up-selling, cross-selling etc.)
For each company, each catalogue item specializes in most cases, obtaining an “account”, an “accounting status”, a “register” as STOCK ITEM or FIXED ASSET. In catalogue item level, someone may have a consolidated picture and common items comparison, as shown to the example:

The Items to the system, as «registers» belong to one from the 4 categories illustrated to the scheme below and are monitored PER COMPANY quantitative or/and in value:

In Stock items, can be monitored trading items or consumable materials for which quantitative and value monitoring is demanded.
In fixed assets are opened all the items consisting a company’s assets and their cost is depreciated with different rules.
Services are items sold having only a value status (intangible).
In Expenses are opened all “accounting” items with value status that are usually provided to the company by others.


Facts Illustration to the System
The system includes 2 big entity categories through which ALL facts concerning the enterprise are monitored

|
|
|---|---|
| |

|
|
| |
| |
| |
| |
|
In each of these circuits, are provided mechanisms of automated "progress" and workflows design with "history log" and "status" tracking functionality at any stage.

The applications have ready to use and parameterized all the usual “scenarios” to “documents” or “tasks” in order the basic functionality of the sub-systems that is originally based, to be available without the need of intervention.

Currency Management
The system manages transactions to any currency. The exchange rates are expressed between any currencies and are automatically updated from Web-service to daily basis, with full exchange rates history keeping.
In each trade account is defined the transaction currency, but this may be changed per transaction. We can issue an invoice or to place an order etc to any currency. Pricelists can be expressed to any currency and even if the transaction that will use these values is in different currency, it will occur automatic conversion. Payments in cash or with fund transfer occur in any currency. Notes can also be entered in foreign currency. Additionally, someone may have the budget in any currency. These results to:
Keeping of multiple trade accounts balances per currency and the respective Ageing of Accounts.
Full monitoring of Available Liquidity in exchange currency
Automatic calculation of possible exchange differences in each on-line payment
Review in foreign currency for companies belonging or referred to multinational organization
An interesting functionality is the one on-demand amounts conversion previews/reports to any currency with the existing or other “given” exchange rate:
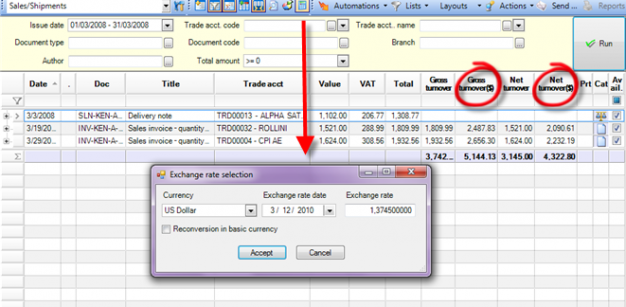
With such an action, the system DOUBLES the columns to the basic currency that is identified for the particular projection, with the indication to the new columns of the selected foreign currency.
Finally, the book keeping currency is defined per fiscal year & EURO-CONVERT process is already provided (for countries that will be included to Europeans countries of euro zone).

System Global Dimensions Management
The system defines (except from the companies & branches which are fixed «subdivisions» of an organization) five (5) dimensions where someone may monitor all the STRUCTURE of cost centers and profit centers, departments- organization services, distribution channel or any categorization of companies activities that is demanded for revenues and expenses analysis (P&L). ALL financial data of ALL sub-systems are kept per horizontal dimension and theirs analysis is provided to Trial balances, journals, Statistics etc. These dimensions are:
Project
Business Unit
Activity
Company Dimension 1
Company Dimension 2
The financial data of some sub-systems are also kept to ADDITIONAL DIMENSIONS. The analysis is provided to Trial balances, Registers, Statistics etc:
Trade accounts sub-systems
Warehouse in Inventories
Journal in Accounting
Some examples as to the way someone may use these dimensions:
Business Unit food, cosmetics, clothes or small-medium-large market
Activity sales, production, financial, management
Dimensions 1 as distribution channel direct, indirect, internet
Dimensions 2 as resource/responsibility center phone numbers, employees
An example for sales analysis cube:


Work Environment
- Login To Application Process
In «LOGIN DIALOG» is selected the data base that someone will work, is defined the name («user») and the application Access code («password»). In this way the user will be identified and will be considered as authorized in using the system.
When typing the password the «***». Symbols will be presented
The Company and the Company’s Branch are mandatory options that need to be selected, enabling application login. The Company and Branch that the user BELONGS will be presented as the default options.

As default login date, the “current day” (PC date) will appear and will continue to appear to all further entries and searching. This date must belong to “open fiscal year”.
The language option is available depending on the product and the purchased version. The language concerns entry and display screens, messages and all communication data with the user whereas the application “logic” (contents, options, discounts columns, screens format etc) is based on the main version for the (country) that has been developed.
When all data are correct, the user will immediately find the main application environment, otherwise a message dictating a possible particular error (connection with data base, wrong version number in relation to data base, wrong password etc.) will appear.
If more than one application servers (server) are found, then, before login dialog, a server selection dialog appears.

Work Surface
The environment appearing after login application includes the following basic data. These basic data enabling information and access to all application functionality:

From this environment is selected the number of functionalities, are given alternative solutions for the access method top these (with «personalization» of communication environment with the user) and is provided the immediate information for system status, login data and server connection.
The minimum screen analysis that the system support (this is screens display without the need for horizontal or vertical shift for basic data projection) is 1024x768 under the following presuppositions:

Deactivation of one of the horizontal toolbars (right click to one of these)

Shortcut list or dynamic Hide (display as «close» and open with mouse over)

Dynamic hide (display) of Windows taskbar
Main Menu
General
From this menu is accomplished
companies and system users management
login data alteration, without login out from the system
backup taken
closing, or exit from the system
Entities
From this menu is accomplished
Monitoring of all application MAIN ENTITIES (customers, items, accounts etc)
Basic data maintenance (alterations, modifications, searching)
Summarized financial information (trial balances, registers, balances control, statistics) of all sub-systems
Transactions
From this menu is accomplished
Documents management, accounting entries management and all types of transactions that concern the various sub-ledgers (sales, purchase, receipts, payments, notes, etc)
Processes of automatic production or documents update (transitions, transformations, workflows)
Analytical information for transactions Integrity control
Business Snapshot
From this menu is accomplished
Monitoring & analysis of the main financial data, ratios, sales progress, budget and cash flow
Sales statistics
Intercompany (CONSILIDATED) reports, trial balances etc from all sub-systems and all companies
Periodic processes
From this menu are executed various processes in periodic basis. Other are accomplished only in the beginning, other at the end of months, other at the end of the fiscal year, other more often:
Items price adjustments, stock allocation to branches, consignments clearance, rebates calculation etc.
Exchange differences
Fixed assets depreciations
Bank statements insertion
The processes of Fiscal Period & Fiscal Year closing & the corresponding legal reports or files taken (Accounting, Inventory, Intrastate, VAT, SRA)
Tools
In tools, will be found all parameterization processes, maintenance and system settings concerning…..
Users privileges
Additional development & parameterization (views, reports, cubes, excel scenarios, entities management screens e.g. Customer screen, item, document, task etc, automations and business rules)
Typical functionality (transactions types, connection with Accounting, policies, groups, types, codes formats, templates, BOMs, payment methods etc)
Automations for implementation (Mass opening of series, print forms copy etc)
Maintenance processes (recalculations etc) and data base management
Updates from external files
Time scheduled operations
Different corrective actions
Information (views, cubes)
Display (menu, settings)
Maintenance (backups)
Display
In this menu
Is determined the windows layout that are simultaneously opened according to all windows applications standards.
Shortcuts and reminders display is activated
Shortcut list is converted to “horizontal menu”
Help
In this menu
Are called helping tools that are related with users guidance (help, manual, knowledge base, tips)
The «about» dialog appears with the exact installation data (software components), the version and serial number, as well as the modules & the sub-systems licenses that are available (purchased)
Helping Tool of direct searching

In main menu lines is provided the searching “field” that allows the word-phrase searching to all documentation, to the menu even to application data but also to Attachments that have been saved to Data Base.

Main Toolbar
New
Direct entry of main entity (customer, item, account, project etc)
Trade Transactions
Direct entry of commercial transaction (purchase, sale, order, retail receipt, expense receipt, etc)
Cash/Notes
Direct entry of cash transaction (receipt, payment, check receipt, withdrawal, deposit etc)
Production
Direct entry of new Production order or Production note, Consumptions Note or Assembly Note
Internal Processes
Direct entry of internal note (in-house transfer, physical Inventory, correctives etc)
These first options directly perform the new entry action, alternatively is performed through the corresponding lists (customers, items, projects, receipts, sales, expenses etc.)
Transitions
Direct call of transition for documents generation from documents of previous stage
Previous
Placement to previous open window
Next
Placement to next open window
Show Reminders
Activation of reminders display to the bottom of work surface
Show Shortcuts
Activation of shortcuts list display to the left of work surface
Close All
Closing of all open windows
Send Internal Message
New electronic message to a user or group of system users
History Log
Call of a list containing the latest actions executed by the user with the functionality of immediate call. History log will also appear using the Ctrl-H buttons combination
Application Help
Call of on-line help system
Fast Insert Pages
Fast insert pages display to processes (alternative access method to operations, instead of menu) per category e.g. Sales, Accounting etc.


CRM Toolbar
New
Direct new entry of persons for communication as well as CRM sub-systems actions of any type, where the current user has access
My CRM
Access to Tasks calendar of the current user with daily, weekly or monthly projection as well as the activities, communications and electronic messages of the user or his group

Marketing
Access to marketing programs schedule, events and campaigns, in public campaigns lists and parameterization templates, as well as complete statistical analysis of the actual facts (response of marketing actions)
Sales
Direct new entry of leads & ε sales opportunities, offers and orders, theirs management lists as well as the full statistical analysis for the control of sales processes (gain, lost opportunities, rate per salesperson etc)
Service Contracts
Insertion of new service contracts, terms management, warranties, provided services & parameterization elements of contracts invoicing rules, access to all contracts invoicing processes and reports/projections of contracts updates control, cash review (response) etc.

Customer Care
Direct entry of Service request, waiting lists per technician/Supervisor, calendar type display for service cases, complaints management, statistics and all circuit parameterization data
Knowledge Base
Tasks Management «Internal Knowledge Base» with announcements, solutions of problems-frequent questions and knowledge articles, with key-words, with publish and send functionality etc.
Internal Menus
The «internal» menus are activated with right click or with SHIFT + F10 buttons combination and give immediate access to the available at this time functionalities e.g. Privileges definition (some users’ exclusion from a field modification) or opening new (new item, new pricelist etc.) or data exemption from display (exempt anyone is from ATHENS) etc. Are the commands known as «context».
To field that corresponds to simple table (code list)

To field that corresponds to entity for which a special screen exists for her management.

To simple numbering field or text field

To the header of a list

To a list «cell»

Actions Menu
Respectively with the «internal» menus (that are activated to “fields” or “columns” inside screens) there are “actions” menus in horizontal toolbar line of the screens that also give access to «related» (context) functionalities for the particular «data set» that we see.
In a management screen e.g. Customer, access to matching, saves to xml etc.

In a display screen e.g. List of Items, massive suppliers or packages definition etc. ESPECIALLY to such lists, the actions that someone may select are functioning «on the selected lines» (except if is differently defined in the dialog with the user)
Shortcut Lists
In the left of the working area, there is the shortcut bar with expand-collapse windows XP style, in which someone may design BY USER according to his every day needs, (personalized menu) In this shortcut list could be placed:
Entry screens having READY data (e.g. Order MODEL)
Management and selection screens with ready filters (criterions)
Menu options e.g. Order transition to invoice, posting etc.
Shortcut List contains GROUPS. The placement of desired options and calls is always achieved through a Group. At the right part of the list, are found close and hide buttons.
Each shortcuts group has the symbol to the right and indicates whether the group is opened or closed.
By pressing right click at any part of the list; it will appear a configuration tools menu of the shortcuts:

|
|
To add an option (shortcut) in the shortcut list we should only leave open the shortcut group that we want to the option to be added
In each application screen there is (either through the “Actions” toolbar option or through special button found to dialogs) an available functionality of this screen direct placement to the current open shortcuts group…..

Through right click on the title of a shortcut group or to a particular shortcut, and by selecting "Properties», the dialogue containing additional settings appears:


|
|
TAB Pages
In «Windows» option of the main menu, the options «horizontal», «vertical» and « Cascade» follow the related options of the majority of MDI (multiple-document-interface) windows applications
The «tab pages» option enables all working area exploiting from every window and the display of “titles” to open windows in order for someone to be able to move between windows while working (through previous-next or directly with «click»).
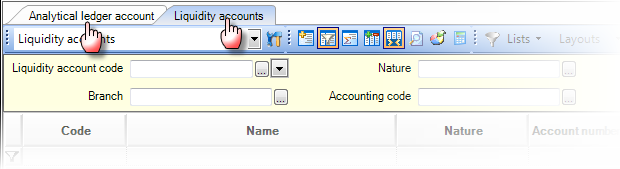
In addition, working surface can be divided into 2 or more parts with separate tab pages development, if there is more than one window:

In order to achieve this, we press «click» to a window title (tab page title) and by having the left mouse button pressed, we reach to the right or bottom area of the working surface until the black intense frame is revealed and leave it.


Status Line
The status line of working area contains a number of information that is related to the workstation and the installation as well as to the current execution (session):


The selected company and branch during application login
The current user
The fiscal year
Application version number
Login Date
Keyboard language
Product code
Serial Number
The last icon shows if there is a connection with the application server
In status line that user may press double click on any of the data and a dialog contains the related data will be displayed. More particularly, the following dialogs will appear:
Company-Branch Dialog

Fiscal Year-Date Dialog

Version Dialog

In processes of problems investigation, compatibilities etc. from installation supporters or ENTERSOFT Help Desk supporters, this information will be probably needed.


Data Management Screens (Sites)
Data management screens are all these screens through which an entity’s’ data modification or insertion, is accomplished. Is called «site» having the meaning of ALL information (360ο view) concentration that is related to the appearing entity (data, available operations, displays and reports, financial, informative or statistical data)
For instance, for a customer, the management screen gives access to his fixed data (elements) such as, identity, accounting data, branches, peers, delivery and invoicing data etc, but also his financial register, the purchased items my him, the Unexecuted orders and a big variety of related information with the particular customer, from all sub-systems.
The format of data management screens depends on the design options that occurred from installation consultant. Very often and while at the following examples someone can see particular (product) option in an entity’s management screen, in the final installation may see a different screen that has been designed based on the particular needs.
- Toolbar
In the upper line of the screen a toolbar often appears containing the basic actions that are expected to executed during insertion, projection or modification of the entity:


| Save | Saves data. |
|---|---|
 New New
|
Saves data and automatically opens the new entry screen. An alternative option that is called in popup menu “New by copy” provokes the same result but it also sets by default the fields values or the details of the current entity. |
| Delete | Deletes the entity by executing the appropriate controls (the entity has not been used somewhere else as a reference etc) |
 Search Search
|
Replaces the current entity of the screen through search for the detection of another based on criterions. The criterion depends on lists parameterization that has occurred, of “search” type. A dialog appears, we complete the criterions, we detect the desired entity we select “accept” and then it appears in the screen by replacing the previous. When modifications have occurred, save confirmation of these modifications will be asked from the application. |
| Automations |
In some entities is possible that operations have been designed-parameterized via “automations” tool and which become visible through the activation/execution option.
|
|
Actions
|
Contains some general actions availably to the entity. Someone may save entity data to xml file or when is found to entity insertion to ask for Recall from xml file that has been previously saved. Refresh (F5) is needed, when the projected data have been modified from another user and are read again from Data Base. The «Shortcuts» command transfers the 1st open group of shortcuts list to the screen with the full data of the particular entity. When we are in a initial insertion status then entity’s data (that have not been yet identified, saved) will be set as default every time we will call this shortcut. Thus, we can create entities entry models (containing the desired data) through shortcuts, for “repeated” or “similar” entries. Through «security» option is allowed to define users privileges for an entity’s management instead of doing it through the general users privileges tool. The «History log» presents all modifications occurred from the particular entity for these fields that has been defined as «monitored» considering modifications. |
| Printout | Through the direct selection of printer icon, the printout is called in a form for the entities supporting this functionality (document) whereas the popup menu through this option gives access to the connected reports (crystal reports) that may have been added to the installation, for this entity. |
| Information |
Through the direct selection of the icon, is called the information section available for this entity whereas the popup menu through this option gives information as to by whom and when entity’s data where modified the last time
|


Identity Data Section
In the screens upper part are presented some identification data of the projected entity. These data vary depending on the entity. Other time is the code and the name and other the document type etc.

In this line appears the
icon when modification occurs, until the time the entity is saved.


Contents Section
In the left section of a screen it usually appears the contents section that can “close” or “open” depending on the space creation need.

Contains «pages» with information that are considered necessary for an entity’s total overview.
Some entities, due to their nature, DOES NOT contain such a menu. Actions or information related to them are called via other ways (from toolbars, actions buttons etc).
The design selection depends on (a) the number of connected information, when it is not limited, this presentation is NOT selected and (b) from the need for full exploitation of the available area for «data section». Such a case (not having “contents”) is the documents where BOTH presuppositions are in force (the “related” information is limited and the need for available space is the maximum)
The placement in such a “page” and her options is achieved through the mouse.

Data Section
In the main screen section are presented the related to the entity data. The 1st page always appears is the «Administration» page containing editable by the user data. When the rest of the pages are called (through «Contents») the related entity data are presented to this section (and as long as the projection lasts, only these are visible).

Especially as far as the «Administration» page is concerned (which is always present even to the entities where “contents” are NOT used, is the only available. Many times in main entities e.g. Customer item, project etc. one or more tab pages are included, ad where someone may be transferred by using the mouse or the keyboard through the Ctrl-PgDn, Ctrl-PgUp buttons. To these, the available fields or other data structures are allocated in categories.
The management of the entity is always completed idependetly if is consisted from multiple information, tables of analysis, (eg. Many suppliers to sto stock item) without the need of data completion to a separate window.
Fields Management - Searching
The transfer between fields is accomplished through Tab or Enter buttons. The field that we are found each time, appears in bold. Fields types are:
|
Reference codes to entity e.g. «Supplierς» or «Constructor» to the item or «Salesperson» to the customer or «Customer» to the invoice |
In these fields someone may
|
|
|---|---|---|

|
||
| If the relevant entity is a MAIN entity, the form usually presents the description and the name to next field wheresearching is ALSO accomplished. | ||
|
Reference codes to code list E.g. the field «Profession» to the customer, , «Country of origination» to the item «shipping method » to the document |
In these fields someone may
|
|
|
Simple text field or Notes field e.g. Description fields, reasoning, comments, notes |
In these fields the internal menu gives the «cut», «delete», «paste» options and by using the F7 button someone may udertake Spell check
Especially in the «Notes» fields that are usually presented with many “lines” available space , is provided a horizontal formation toolbar for font alteration etc. |
|
|
Numeric Field E.g. Value to documents lines, discount to item, to customer |
In these fields, an automatic formation exists depending on (a) if values or prices are in % (b) the currency and (d) the user “language” (for decimals separators). In addition, with the = button we can undertake a numeric calculation, by using numeric symbols, χρησιμοποιώντας αριθμητικά σύμβολα, parentheses and by pressing Enter we get the result.
|
|
|
Date Field e.g. Doc date, contract expiry, defined date |
In these fields and either if we directly type the date or we open the calendar through the arrow (drop down).
|
|
|
Time Field E.g. customer schedule, visiting time – project action, meeting duration |
The time
|
|
| Default options Field |
There 4 fields categories with predetermined system options
|
|
| Multiple hierarchical characterizations Field |
These are text fields that accept multiple options, appear in a double list dialog (available and activated options) and are selected through the «add» and «Write-off » buttons. The entries in the list have been designed in installation level (are not by default)
|
|
| Multiple characterizations Field | These are text fields that accept multiple options, appear in a dialog and are selected with the mouse in a simple or hierarchical list which has been designed in installation level (are not by default) eg. Customer preferences, keywords of a Knowledge base artict etc. | |
| Numeric field with increase/decrease |
Concerns fields of integer values of «byte» type where except from the typing functionality are increased or decreased through the mouse (up-down):
|


Errors Management
During typing, there is a visual recognition of false values and fields that are required in order to avoid the mistakes and the user subsequent information if it has not completed a required field or when he provides restricted value

If you move the mouse on the error icon  , then we will see the reasoning in the form of help text (tooltip)
Finally by finishing the entry and when there are problems of logic controls that do not allow the save, these are presented in a dialogue per unit with an explanation and with direct movement functionality in the error field
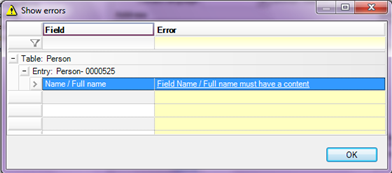

When error management cannot directly occur, the presentation differs. The error may referred to other system section and when someone cannot directly correct it, the technical information are given enabling in this way the installation consultant to detect the area seeking correction (an example Is the errors in « Accounting post» setup of the documents):

If the error is not understandable, is given the functionality of direct mail sent to Support Department of Entersoft, with all the technical details, through the "Send" icon. .
.
Lists Of Data Display (Scrollers)
The scroller type is the largest screens category as far as the variety and the degree of use is concerned. A whole sub-system (Scroller/Cube Designer with main element a strong “query builder”) is responsible for their design, aiming to be able to be used from trained users and to produce even the most complicated layout and processing data scenarios. Theirs functionality in summary :
Present in different ways information taken from data base
Through them is given access to data management forms for modifications
Through them are executed many massive procedures on the presented data
Through them data are exported in different formats for use from other systems or electronic send
Processes demanding data selection with dynamic criterions use scrollers to ensure the parameterization of the criteria (since as designed by consultants, users, technicians and are not part of the application - the 'Code').
This document will be considered from the perspective of end users only
1. how to operate
2. functionality
3. The formatting options
All these depends on the purpose of each scroller and thus, by her design and are not likely to coexist on the same scroller. The way its functionality given through the parameterization, is explained in detail in the technical manual "Reporting Tools”.
Structure Data – General Description
The main structure data in a scroller screen are:
Toolbar
Criterions area
The list (grid) of results projection
The management tools column of the list
To see the results of a scroller we should fill the criteria and select «Accept». It is important the criteria to be completed, because every time we ask for the scroller calculation with this command («Accept»), is communicating with the server and the database, so the more is the number of records we request (as defined by the values of the criteria) the longer it will take to get the result and the more we delay the work of other users that currently use the system.

In the horizontal toolbar on one scroller, in the left part, you may select other aspects that have been saved in the same folder (with * are shown the "custom" scrollers of the installation) and with the
key next to the name, someone may go (if having the privileges) in the scroller design tool


Criterions
In the criterions area there are parameters, the "questions" that have been predicted to the scroller, against which the results will be searched. Once completed, the «Accept» button must be pressed (or F5) in order the related transactions to appear. .
The criterions appearing underlined must be completed. This is compulsory.
In some scrollers, in criterions area, the
 icon appears on the right top. This means that the displayed criterions are sufficient but in some cases, some additional criterions may be needed. These criterions are displayed through this button pressing («additional»).

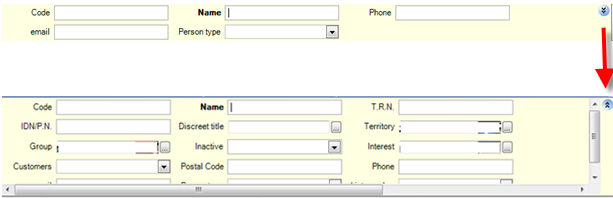
From the related button of the full criterions screen

The buttons having close the
 icon, can take more than one values. By pressing this button «F3», it will appear a list from which you may select as many lines as you want (in a row having the left click pressed & «Shift» or to distinguish them using «Ctrl». When more than one value is selected, the multiple values wording will appear to the criterion. The reason that a choice is given is due to typing that it may occur in another language and case compared to these that data have been saved.

Selection of particular «Cities» or «Professions» or «Categories»
In all fields where search may occur, searching can be achieved in the way mentioned before eg. In the simple text fields such as Description, name (wildcards) can be used and in this way to define the presented transactions for instance, we may define «1*» meaning «these starting from 1» or «*1» meaning «these ending to 1» or «?? » to a ledger account list in order to take the “First level accounts” accounts etc.
A* that means «these starting from A»
*Α that means «these finishing to A»
*Α* that means «these containing the A»
?? that means «these having exactly 2 characters» (Α΄Level Accounts)
Α?? that means «these having exactly 3 characters and the 1st is A»
6*\,7* that means «όσα these starting from 6 or 7»
In some criterions appears simple or multiple options through “click” by pressing the
 icon.
icon.


The fields having closed the
 icon take one of the default values appearing at the time of the icon pressing. When someone selects (click or F4) he may select the particular-default date ranges compared to login date, instead of typing date limits through the below dialog:


Through «click» to one option, the option will be interpreted to dates and it will appear to the field position in the criterions area. The options with «...» opens fields to be typed, if activated («click»):

Select with «Enter».
Grid
The grid enclosed the data that were identified from the Data Base or were calculated after criterions application.
The header with the columns names is the 1st structural element of the scroller. Through this area a number of operations that changes the format and other properties of the visible data, may occur.
Column Shift
This is accomplished by selecting (through left click) a header column and drag this column to the desired area (until the two red Arrows indicating the new position, appears)


Sorting
With left «click» on a column of the header area, the data found to the grid will be automatically sorted based on the column values. When the “click” is repeated, the sorting is altered from ascending to descending. Next to the title,
and
icons define exactly this, as to the Windows Explorer.
The sorting based on multiple columns is also accomplished through “click” but by having the “Shift” button pressed and the multiple sorting is applied based on the columns selection ORDER (clicks)


Groupings
In a scroller, is given the functionality of existing transactions grouping based on one or more fields and in this way, we can mange transactions based on their common data.
In the horizontal toolbar is found the
icon through which the grouping area is displayed or hidden over the grid and where we can place the « Grouping fields ».
When we drug a column there (with drug & drop in header title) then the transactions that are grouped based on this field and the transactions appearing in a tree format. The grouping fields can be multiple. Thus, if we want to group the items based on the “family” & and “group”, the presentation will be as shown to the scheme:

In this way, someone may create a customer’s hierarchy e.g. Customers per city and salesperson, receipts per branch and user, items per business unit, supplier and invoicing category, sales opportunities per salesperson and origin etc.
When the display is finalized, we can select the same icon for hiding the grouping line in order to save space for the data, for the “grid”.
If the scroller displays for instance, transactions or tasks or documents etc. with date type columns then, by pressing the right click on the column title and by selecting from the popup internal menu “Dates grouping”, we have the functionality of grouping the data in a special way to dynamic time ranges compared to “today”:

In the displayed dialog, we select the analysis depth (Days, Weeks, and Fortnightly etc). Upper number of years or months (depending on the maximum depth analysis) as well as the past or future analysis (when there is an ending date). At the right appears the generated analysis. The scroller result appears after the dialog exit (“Accept”):

Grouping removal is achieved from the same catalogue with the button of “Deletion”.


Totals – Sub-totals
In a list containing columns with numeric data, there is an available functionality enabling sub-totals calculation. Select the
icon from the toolbar.
The result is that a total line is added and when there are groupings, sub-total lines are added to each group end. The totals type, sum, weighted average, maximum, minimum value etc) is defined in scroller design.

Another method to define totals format is via the “properties column” through right click in column title.


Add – Remove Columns
With right «click» in a header column and by selecting «Edit formatting» either through the  icon from the horizontal scroller toolbar (see. Structural data) where we have access to a list of non visible columns that we can “drag” to header area to the desired position (through «shift» method and the red indicators. icon from the horizontal scroller toolbar (see. Structural data) where we have access to a list of non visible columns that we can “drag” to header area to the desired position (through «shift» method and the red indicators.
|

|
|---|---|
| From the «hide column» option, the column in which the internal menu was activated through “click”, is transferred to | |
| the “available” visible columns. |
Column freeze
From the same internal menu, the «column freeze» option, results to the visibility maintenance of all the previous columns (on the left) of the selected, in order to have a horizontal bar, “identity” data are stable.
Rename
From the same internal menu, in “column title” option, we have the functionality of altering the column name without being necessary to enter to scroller designer.
layout
From the same internal menu in «column layout» option, the layout can be defined in numeric or date columns E.g. The #0.00 value determines that a numeric column will appear with 2 decimals, with c value appears the currency symbol that has been defined to Server Regional Settings whereas the d value presents a date column based on short date format that has been defined to Server Regional Settings.
Direct Filters Line
In the upper part of a list (under titles line) there is the «direct filter»
line. This filter enables the further data processing of a list, and is very quick under any conditions as communication with the data base and the server, is not demanded. As filters, we may insert either a particular value (by typing or selecting from the drop down list) or part of the value (by also adding the *).
In order to remove a filter already inserted, we just need to click the icon.
Hide of this line, in order to save space for the data, is accomplished through the horizontal toolbar using the icon.


Filters in a «Cell» (Row-Column)
By pressing «right click» at any part of the data area, a popup “internal menu” with a number of selections for direct dynamic filters application, appears.
|
By selecting «Filter Equal» the list is automatically readjusted are “left” only the rows where in the particular field (column), have the particular value.
|

|
|---|---|
| By selecting «Filter Not Equal» the list is automatically readjusted are “left” only the rows where in the particular field (column), have ANY VALUE DIFFERENT FROM THE SELECTED. In the previous example, all customers from Melbourne will be excluded from the list. |
This processing is always accomplished on the result of the previous action
| By selecting «Filter» and by giving a value, in the list will remain as many lines have this value in the column where right click was pressed. | 
|
By selecting “Remove filters” the list reappears in her initial format, this is according to the typed criterions.
Rows Counting
|
From the same internal menu that appears through “right click” in a part of the data area, the “Settings” option allows:
|

|
|---|---|
|
|
|


Hierarchical Scrollers
In hierarchical scroller, is accomplished processing of two or more different data set that are connected with a common element, in order a “tree” picture to be generated. For example,
Salespersons with their full data to 1st «level», in 2nd «level» the customers with theirs data that each salesperson has taken over, in 3rd «level» customers turnover per month.
Items in 1st «level» and theirs balance per warehouse in 2nd «level».
Documents in 1st «level», documents lines in 2nd «level» and items serial numbers in 2nd level
A hierarchical scroller initially appears having “closed” the lower levels in order no time to be spent for information extraction from DB without this being necessary. The user selects the “opening” of a node through the
icon found on the left of the grid (or the “closing” through
icon) if he wants to undertake development or packing level (as to windows explorer). During node opening the information are read and presented. With Ctrl + we can ask for all levels and all lines “expand”.

Each level may have its own “groupings”. Grouping is not a “level” even though there is a “tree” presentation. Each grouping is simply a “header” (without its own distinguished data) whereas each hierarchical scroller node leads to different scroller information (drill down to a line’ “details” or “analysis”).
In the above example, in the 1st level of the scroller are the sales documents, whereas items information that each document contains, appears in 2nd level.
An example of a scroller with groupings (but not with hierarchical levels of information) is “List of documents” that appear the documents by document class and menu entry.


Drill Down To Scroller
Some scrollers give the functionality of “closer-look” (drill-down) to next level information not in a hierarchical tree format, but by the display of a new window with the data of the next “level”.
What is the difference from the hierarchical scrollers?
The level of information “closer look” does not refer IN TOTAL to the projected line (as with the hierarchical scrollers) but also to a particular COLUMN (“cell”). Thus, it is possible to appear a different “drill down” (such as quantity, value) in a line presenting 2 value fields.
In the column where someone can ask for drill down, the
symbol appears and the mouse format is modified:

In Period Summary or in Ratio of «Business snapshot» menu or in VAT Declaration for instance, drill-down is provided in different columns. In the dialog displayed when pressing the


This functionality, and other than the organized information provision, enables to data investigation processes and Trial Balances agreements processes or other reports.
Composite Scrollers
Some scrollers give the functionality of simultaneous display and change of the presented entries full screen e.g. Persons Management, Incoming mails etc:

The screen of such a «composite scroller» is divided into 2 sections:
Scroller grid
Display form of current entry
When someone moves the grid from row to row, in the 2nd section are presented the entry’s (with all full data “sub-pages” and the entry’s management screen in the vertical tools line as these were presented in «data management screens») chapter.
As long as the
button is activated, if modifications occur to fields of form section, then, by moving to other scroller row, save of alterations occurs automatically otherwise saving must be asked through the
“save” icon.
As long as the stabilization
button is activated, the form binds the bottom screen section whereas if deactivated, the area is released for the display of maximum rows number. In order the form to appear, we select the «Entry» panel. Additionally, the full data form «opens» in the initial position, just by (mouse over) from the point («Entry»),


Scrollers Of «Card» Type
Another scroller category is the «cards» that are useful for few data entities presentation where a “vertical layout” is provided, as happens in the case of the photos:

Similar presentation has been selected to some “lists” inside entities management screens, where fields are few, and then theirs management within only one row, is convenient (as the code lists). Thus, the fields are sorted in cards with 1 or more fields columns for easy «line-input», and not in rows. Such a list is used in customers Addresses/Branches, in Contacts etc.

Someone may choose between simple list and list of this type from the switch layout icon found in the vertical toolbar.


Immediate Print
Any scroller can be printed from the Preview tool that is integrated in the horizontal toolbar with the
icon.
This report is available to ALL scrollers and in the current format-sorting-grouping-filters, that the user has applied and sees at this moment.
By asking for preview, the scroller appears in printing format, with page numbering, the date and print time as well as, with a default “formation” in the following dialog:
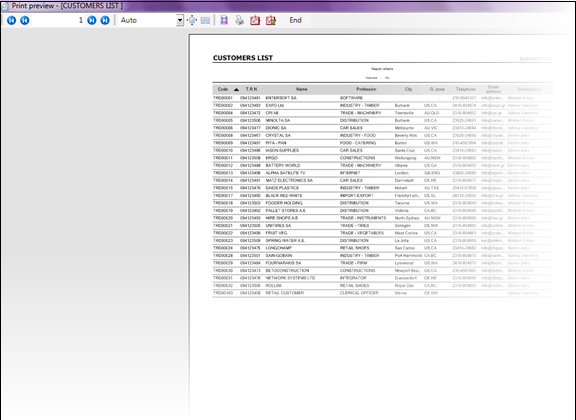
From the dialog horizontal toolbar, the user may:


 Move between pages
 Particular zoom in- zoom out to be asked
 To send the report directly for print
 To save the report to PDF file in a folder
 To send the report with mail in PDF file format


Finally, with the
«Settings» icon someone may change the title, the date, the fonts, to select horizontal or vertical, separating lines, criterions printing or not, portrait or landscape layout, particular printer, «watermark» etc. and to save all these as a «template» for all his reports.

chart
From a scroller horizontal toolbar that has at least a numeric column, chart presentation can be asked:

The chart is always formed from the 1st grouping filed, and if there is not any grouping, based on the 1st column values (as one dimension), the values of numeric columns are developed in the 2nd dimension. These columns are selected from the user in the dialog appearing with the “Properties”:

In the chart screen, there is the horizontal toolbar that allows the chart print, the save, the illustration selection from a big variety e.g. Lines, bars, areas etc, the colors selection, the titles presentation etc.


Conversion To Currency
An interesting functionality is the on-demand amounts conversion to any currency with the exchange rate that is in force or other “given” exchange rate:
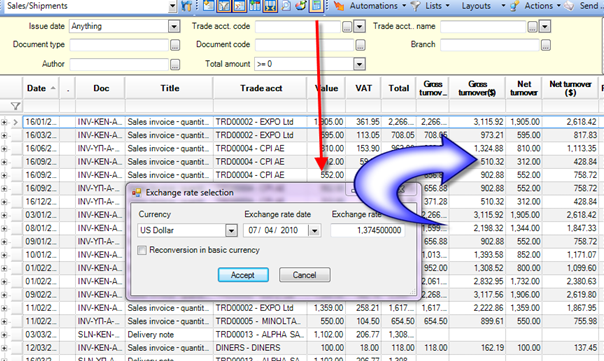
By selecting the
icon from the toolbar, the currency selection dialog will appear, search of exchange rate date (the exchange rates are daily entered through web service and this can be automatically accomplished).
With the «Accept», all columns identified that are expressed in basic currency are DOUBLED and the new columns have the indication of the selected foreign currency in theirs title.
For columns in alternative currency abolish, we select again the


Data Export
From each scroller horizontal toolbar with the “Send” option, scroller data export can be achieved in different formats with many different functionalities that someone may need, from the processing and use of these data from an external system:

In the presented dialog, someone selects the format:
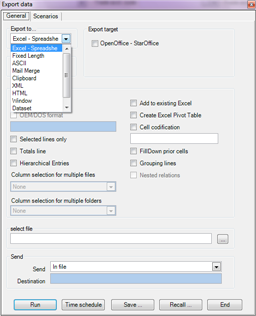


- Excel, where there is the functionality of cells coding and addition to an existing work sheet, in order someone to be able to prepare “scenarios” and after data export a predetermined work sheet with calculations on the “primary” data, in the desired format.
- HTML
- Data Set (xsd)
- XML
- Window
- Clipboard
- Fixed Length file, when dialog format changes and allows scheme and file properties definition, based on the scroller columns
- Mail merge, where a mail merge type definition page appears to «letter» (word), FAX, eMail
- Printer
With the « Scheduling » button someone may define automatic export with the desired frequency.
By defining the export file name, there is a parameterization functionality in order this name to be dynamic, with the use of a number of data such as the date, the time, the user, the branch, the company or and the value of a scroller parameter.
By defining the name $CSConfig${company}_{yyyy}-{mm}-{dd}.html, the «ES_2007-01-22.html» has been generated to CSConfig folder
Immediate Actions
Shortcut
The current scroller can be inserted to the Shortcuts (on the left, in 1st “open” shortcut group) in order to be directly executed and with the given criterion values. This is achieved from “Shortcuts” option of the «Actions” menu of the horizontal toolbar:


Entity Display
In the scrollers illustrating entities, in most cases, it has been given the functionality (during scroller design) of current entity presentation, her management form, to be feasible (e.g. The item screen to an items list, the customer screen to a customers list etc). This is achieved:
With double click
With the Enter button
With the
 icon selection from the vertical toolbar

New Entity Insertion
In the scrollers illustrating entities, in most cases, it has been given the functionality (during scroller design) new entity insertion to be feasible (e.g. New item while we are found to items list, new order to an orders scroller etc.). This is achieved:
With the Insert button
Through the
 icon selection from the vertical toolbar

Mass Delete
To the scrollers is allowed, someone may select “mark” some lines – entities, (with pressed shift or ctrl and click) and to ask delete ALL with the following ways:
With the Delete button
With the
 icon selection from the vertical toolbar

Obviously, the deletion will only occur if the user has privilege for deletion, and if there are no entity’s references to other tables, for instance, to have no entries.
Global modification
There is the functionality of fields’ global modification to the selected (“marked”) scrollers lines/entities from the «Global modification» option of the «Actions» menu of the horizontal toolbar:
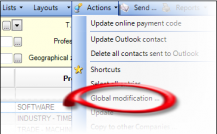
By selecting this task, is presented the dialog where someone may select the field that he wants to modify with a particular –same value to all entries, from the list of available fields.

Depending the field type to be modified, different functionalities are given. If for example, is a selection field, in “value” field (the new value that the field will take to all entries) the default options are presented, whereas if it is a code list (e.g. Category, group, city etc) or an entity (e.g. Measurement unit, allocation profile, person etc) in «Search» field someone may find the desired value by pressing the  button. button.
|

|
|---|---|
| We can also define to become «null» (the field to become empty) or even, an expression. |
Finally, an interesting functionality is that through an “expression”, can be defined that the new value will be the value of another scroller field or on numeric values, calculations between fields.
In an items list that presents the Wholesale price and we want to modify the Retail Price to all items in terms of 20% increase of Wholesale. This is achieved with an «expression», by selecting as 1st term the «Wholesale price» field and by typing the «*1,20d» expression (for rounding in price decimals).


Refresh
Through Refresh, is achieved data base retrieval and calculation – scroller data reappearance:
With the F5 button
With the
 icon selection from the vertical toolbar

Financial Data Reports (ΒΙΤs)
A number of application financial reports (ΒΙΤ – Business Intelligence Toolkit) are designed in a way that recognizes and automatically takes advantage the STRUCTURE OF FINANCIAL DATA. The most often reports taken are the Trial Balances, Registers (Account Statement) the Journals and Inventory Register of all sub-systems, as well as the concepts “From inventory” and “Brought Forward” role playing to financial reports as to the correct running balances configuration. They have default criterions which serves the financial control.

- Toolbar
In order results to be estimated, «Run» must be selected. The «print preview», the «charts», the «shortcut» creation and «data export» are functioning in the same way as with the Scrollers. The «Basic data» option concerns the placement to «display page» that may co-exist with «print pages» (with the final printing format) that are usually integrated (at least for the official reports).
From the «Reports» the connected reports (Crystal Reports) are called with the requested layout.
From these reports, especially, the save in PDF format is accomplished through the horizontal toolbar of the report screen, which is a little different from the print preview.
Many times in a BIT, are provided different reports formats, depending on the printer or other differences to layout.


The Criterions
The functionality is the same, as with the scrollers. At this point will be explained the functionality of some special criterions that have predetermined position and role to BITS:
Time Range And Fiscal Year
As far as the «period» of financial statement is concerned, the criterions are always two: the date range determines which data will be illustrated in detail (in “period” columns in Trial balances, detailed entries in Registers and Journals), whereas the “fiscal year” determines the “inventory” data source. The intermediate time range, when exists, determines the «brought forward». As «Fiscal Year» is suggested the one corresponding to the beginning of the time range, except if there is a parallel operation to TWO fiscal years and then the previous fiscal year is suggested, in order the “temporary inventory” to be calculated. The «Official reports» is an exemption where there is no temporary inventory and “starting fiscal year”. Fiscal year will be the one corresponding to the begging of the requested time range.
Suggesting that we have in the system 3 Fiscal Years: 2007, 2008, 2009. The last fiscal year closing occurred in 2008.
We call a ΒΙΤ for the 1/6/2008-31/12/2008 time range. “Starting fiscal year” will be 2008. This means that inventory will be taken from 2008 whereas the brought forward amounts will be calculated from 1/1/2008 until 31/5/2008.
We call a ΒΙΤ for the 1/3/2009-31/3/2009 time range. 2008 is suggested as the “starting fiscal year”. This means that inventory will be taken from 2008 whereas the brought forward amounts will be calculated from 1/1/2008 until 28/2/2009. In this way we get the “picture” that the next fiscal year closing will logically generate (2009).
We call a ΒΙΤ for the 1/3/2009-31/3/2009 time range from the “Official statements” end of periods. 2009 is suggested as the “starting fiscal year”. This means, and since fiscal year closing has not occurred, Inventory will be ZERO whereas the Brought Forward amounts will be calculated from 1/1/209 until 28/2/2009.
When someone gives to the time range, other than the starting-ending period, the process is automatically recognizes which ready (periodic) data can use in order to estimate the “brought forward” and which data will calculate from the detailed entries (entries). This means that «periodics» SUMMARISE the data from the detailed entries, in order these to be available for quick calculations to Trial Balances, Registers etc.
Select
A standard criterion exists to all BITs is the “select” criterion with the deafult value “Not zero. What does this means? Every BIT concerns a main entity (the Accounting Trial Balance, Customers Trial Balance and customers etc). With this criterion, we define the Accounting Trial Balance, the accounts, Customers Trial Balance, the customers etc). With this criterion we define which “main entities” will be included to the report as far as theirs ENTRY is concerned.
 With amounts in period. By selecting the entities that have entries within the requested date range. It is logical that if we take for instance, an accounting Trial Balance , the accounts that have not got any entries within this period are left out and thus Debit and Credit, in the final totals, will NOT come to an agreement.
- With amounts in fiscal year. Are selected the entities having entries within the Fiscal Year or period but these having only Inventory, are exempted. In this way, if we get for instance, an accounting Trial balance, some accounts that do not have entries but may possibly have zero inventories, are omitted and thus it is not expected that the progressive totals (final totals) Debit and Credit will be in agreement.
- Not zero. Are selected all the entities that either have inventory or have entries within the Fiscal Year.
- With balance. Are only selected the entities having zero “balance” at the end of the requested date range. In each sub-system, it has been predetermined from the application, what “balance” means. For Trade accounts, Fixed assets, Special accounts, and Ledger accounts, balance equals the difference of Progressive Debit and Progressive Credit whereas for Inventory, balance is translated as the “quantitative” balance (Imports and Exports quantities, difference).
- Negative balance. Are only selected the entities having negative balance at the end of the requested date range. This option is useful for control. The balance sign is predetermined from the application per sub-system. For instance, Customer with negative balance is the one having credit balance whereas Supplier with negative balance is the one having debit balance.
- Positive Balance. Are only selected the entities having positive balance at the end of the requested date range.

|
Grouping
To all BITs, based on the predetermined process and the structure of ready periodic data, is provided the selection functionality of data grouping, usually based on some of the following fields:
|

|
|---|---|
|
|
|
The ROW of the groupings is predetermined from the system.
Periods Analysis
| To the ΒΙΤs presenting summarized information such as the Trial Balances, is given the functionality of additional grouping PER PERIOD, for the case where time range includes more than one period. | |
|---|---|
| Thus, while in a Trial balance typical format, there is ONE line per entity, if let’s say a three month period is asked having the «periods analysis» criterion activated, each entity will be developed in 5 rows (Inventory, Brought forward, and one row per month in a three month period). | 
|
Date Grouping
To the ΒΙΤs presenting detailed information such as the Registers (Account Statements) and the Journals, through this criterion is provided the functionality of hiding the detailed entries as well as the amounts presentation PER DATE, this is one register line containing the totals per date.


With Running Totals
To the ΒΙΤs presenting detailed information such as the Registers (Account Statements) and the Journals, through this criterion is provided the functionality of running totals columns automatic display or hiding. These columns are as many as the Bits’ numeric period columns.


Totals Table
In some ΒΙΤs the totals area is found to the right of the criterions used for control reasons. This means that in order for someone to analytically examine the results or to be transferred to data grid, up and on the right, are reported the most important of the final totals of all the calculated entities. Concerning the important numeric sizes (debit, credit, quantity-value etc), the table usually presents the from inventory total amounts, brought forward and period.
Data Grid
- As far as the summary statements of Trial Balance type are concerned
The data are developed in rows per entity and field grouping with columns, numeric data divided into 2 categories => «Brought forward» and «period». Sometimes the «Inventory” is displayed as distinct column and other times are incorporated to the “Brought forward”. At the end is calculated the Balance and the “running totals” are displayed or not (depending on this criterion)

With «double click» the management screen of the current entity is called.
With the
icon of level developing, drill down is accomplished to the detailed entries that configured the illustrated period amounts.


- As far as the detailed statements of Register type are concerned
The forwarded amounts up to the requested period are illustrated into 2 rows in the begging, one for the inventory and another for the brought forward. Continuing, the detailed entries are presented:

The entries are developed one by one in the degree where the illustrated data to the particular BIT differ from one or more numeric columns otherwise are grouped and added in order the report to be readable.
If in a ledger entry or a document, an expense “line” is repeated N times with the exact same document data, alternative document, date, reasoning etc. with different amounts PER PROJECT or ACTIVITY, in a register WITHOUT grouping for the particular dimension, we see ONE LINE containing the SUM of the amounts. If we ask for the same register with grouping per project, (or activity etc) then, the entries will appear in detail, in order to update the sub-totals of the grouping.

With «double click» or through the
 icon from the horizontal toolbar (which is slightly differentiated to Registers and Journals) the screen of the particular document is called. If it is about accounting ledgers, the entry appears through “double click” or through the
  icon, whereas the document through which the journal entry originated, appears through the icon.


Business Flow Charts
To all sub-systems, through «transitions» are produced next “stage” documents. The information kept to these relations (origin-destination) between documents, supply business flow charts and give immediate, comprehensive, overview of the procedures that were followed.
- Call
Charts call is achieved...
|
|


The chart displays the summarized document data that are generated from the current document, with the rest of the connections.

In this dialog, a number of options, settings and operations are available through the icons on the scheme as well as through the dialogs buttons on the dialogs’ bottom part.
Contents
As far as the data and the functionality ON the chart is concerned:
Cancelling documents are exempted from illustration, whereas the cancelled appearing with special indication (
 ).
).With double click on the document number («header frame») we have access to it.
 By selecting the icon on the upper left part (
 ) we get information as to documents’ « development steps» (for transitions «on the same» - when passed through credit control, when it was routed etc. depending on the business flow). On the upper left appears the step at which is found.
By selecting the button icon, to the bottom right (
 ) a list with the «main» γραμμές του παραστατικού appears ( e.g. Items list in an order). The lines in this case are ALL, whereas……
 By selecting the
  icon ON the connection line, items «service» quantities are presented (e.g. Order quantities that were invoiced).
Each documents category (class) has a different color pallet.


Form & Print
As far as the screens’ last row selection fields are concerned:
- The option «Documents presentation» activates either the «attachments» (these related with the particular document ONLY – this is one stage of the «flow») or «all» participating to the chart, the “attachments” AND all these participating to the current document flow.
If an order was delivered with 2 Delivery Notes, from the 1st Delivery Note, we only see the order when selecting “attachments”, whereas with the “all” option, we see the 2nd Delivery Note as well.
The «Layout» option allows diagrams’ alternative illustration methods («tree» is the default. There are also available layouts of “levels” or “table” type).
The «Zoom» option is the classic functionality of data display in zoom in or zoom out.
By selecting the «refresh» button, the data are read again from the base.
With the «reframing» button the diagram reappears with the initial default settings.
By selecting “print” it will open the dialog with the printing options:


Cubes Data Analysis
The cubes are used to many systems’ parts when the format of the required information is “multidimensional” but are mainly used to the “business snapshot” options of the menu.
The cubes design sub-system is described to the «Reporting Tools» technical manual. In the current manual, will be considered from the perspective of end users only:
- The handling method
- the functionality
- the formatting capabilities
Structural Data
The cube is a data table («counters») which is developed to many independent and at the same time hierarchically illustrated «dimensions». The main structural data in a cube screen are a) the toolbar b) criterions area c) the horizontal and vertical dimensions area and d) the data projection grid.
In order to view one cubes ‘data, we must fill in the criterions and select “Accept”. It is important to complete the criterions in order to eliminate the required data set as every time we ask for results calculation, the bigger the entries number requested, (that are determined from criterions values) the more time will be needed in order to get the result and the more we will delay other users tasks that use the system at this time.


Toolbar
In the horizontal toolbar of a cube, in the left part, someone may select other cubes that are saved to the same area.
With the
 icon, someone may pass (if has the privilege) to cube configuration.
The print preview
 and the shortcuts
  are functioning in the same way as with the scrollers.
With the
 icon, the illustrated layout changes in order the columns to become lines and the lines to become columns.
With the
 and
and  icons, the sorting as to the columns or lines data VALUES, is activated. What does this mean? The data are initially sorted per dimension “code” with alphabetical sorting e.g. Group A firstly, then group B, group C etc. If we ask for sorting while found e.g. to “Turnover” cell, the groups will be sorted per Turnover e.g. The group with the greater turnover first, then, the group with the next bigger turnover etc.
With the
 icon («Time levels») which is meaningful to cubes including a “date” as dimension, someone may select automatic display to different sizes “dimensions” arising from dates grouping


 e.g. “week», «day of a week” “month”. For instance, in the, “items sales for time range” cube that posses particular dimensions in his design, (month, customers group, items category, branch etc) by selecting to the time levels «Day in week”, is automatically displayed as Time dimension in to the dimensions area for cube use. Continuing, as any other dimension, can be used as data grouping to lines and columns. e.g. “week», «day of a week” “month”. For instance, in the, “items sales for time range” cube that posses particular dimensions in his design, (month, customers group, items category, branch etc) by selecting to the time levels «Day in week”, is automatically displayed as Time dimension in to the dimensions area for cube use. Continuing, as any other dimension, can be used as data grouping to lines and columns.
|
With the
 icon, we get the cubes’ current sorting, in Excel.
With the
 icon, we get the cubes’ current sorting, in Html format and is projected through Internet Explorer.


Criterions Area
In the criterions are, there are parameters, the «questions» that have been predicted to the cube, based on which the results will be searched. When completed, the “ACCEPT” button must be selected (or F5) in order the entries satisfying the criterions to appear. The handling that is in force to the various criterion categories is just like in scrollers and is described to the related chapter.
|
There is however, a differentiation to the time range criterion when is expressed from “period” field. In this case, in some cubes that usually have the «comparison by year and month» title, is given the functionality of the selected time periods automatic comparison via a dialog of a special type. Someone may select years and comparison time ranges either in particular or in relation to the current date. |

|
|---|---|
| The need that is served through this functionality is to be able to ask ONLY the data that we are interested in eg. The comparison of the 2nd 3 months this year and last year no to requires asking all 2 fiscal years data, but only of the particular months from both fiscal years. |
Dimensions Area
The dimensions area includes:
The vertical and horizontal dimensions to which the results are developed. Someone may “drag” with drag & drop one of these dimensions outside of the axes and also το carry a dimension from the horizontal to the vertical axis and vice versa..

The additionally available dimensions (based on cube design). Someone may “drag” with drag & drop any of these dimensions to the horizontal or vertical axe. .

The «Data» option, where possible and available counters are presented (numeric sizes) but are not visible in the current cube sorting. Someone may activate some data or/and diactivate some visisble columns.

In dimensions, in each of these data (controls), there are the following functionalities:


 To apply direct filter (hide or activation of some values from the displayed in the cube) by selecting the arrow near to the field name:
To select the sorting way
 :
:With «right click» on the field name we can also:
Activate or deactivate the totals as to the particular dimension. If for example a dimension is the year, to total for more than 1 year, we are usually not interested to.
To «close» a dimension or to ask “open” – dimensions’ developing


Data Area (Grid)
In the data area, the grid consists of “cells”. These cells may display primary data for (the line and column dimension value) or totals. The configuration functionalities in this area are the following:
- Creation of «progressive» columns. In order to activate such functionality, there must be a “time” dimension e.g. Year, month, date and another one for progressive total initiation. In the column that we want to see a progressive total, with double click, an internal menu including this option emerges, we select “progressive” and the column is automatically added and calculated:

- An example of an appropriate use of this functionality, is the Inactive stock cost cube in the Inventory System where is presented how, in a time scale, the cost of stock, is increased.
 Creation of columns % percentage “participation”. From the same arising menu, with the “percentages” option, someone may activate the % on the partial or the final totals. For instance, in a cube with turnovers per items category, someone may see the way (in percentage) every item category participated in total turnover, or when in same cube we have dimension per branch, to see the way that each item category participated to the total turnover and to the turnover per branch:
Scale selection. From the same arising menu, with the “scale” option, someone may view the numeric sizes to hundreds or thousands, by selecting the scale and leaving the cube to undertake automatic division.

Calendars
The Calendars are control screens and tasks programming (agenda) individuals or groups of people or generally resources and are used to a number of C.R.M sub-systems for salespersons programs, the calls calendar to secretarial positions, for the service queue for the control of room use, (resources availability) etc
The different calendars have similar presentation, common characteristics and functionalities.

The structural data of a calendar are:
The toolbar
Τhe Time schedule /plan
The data scroller
The «closed areas» (panels)
The whole screen consists from «panels» (visible or just available) that can be activated or deactivated, to change the size and position, to be always visible or to dynamically open (with mouse over).
This configuration is achieved in such a way in order to match to the maximum degree with the working style and the data that each person or working position is prioritized.
- The Toolbar
In the toolbar, there is an available row of icons loeading to new task insertion per task type
 . The icon is defined to task types.
With the “show” option someone activates the display of the areas that have been deactivated.
With the «synchronization» option, as long as someone follows the timetable, automatic placement to the scroller and vice versa, is achieved.
With the icons of plan details selection
 someone may switch between day, week and month, views

Whereas with the icons of plan details selection
 is achieved the same switch, but in a timetable format where the time consists ONE line.

If some of the toolbar options that you may see to the current, are NOT visible, you may activate them from the right edge of each icons group:


The Timetable
In the timetable area, other than the data management of a task in a full screen, using “double click”, someone may manage tasks directly in a graphic way:
To shift a task to another day «by draging it» on the timetable. The mouse pointer change sformat during selection and shifting:


To change duration of a task by using the increase/decrase icon to the sides of the cell:


Tasks Scroller
 In the scroller area are provided different configuration conveniences from the horizontal toolbar (known from scrollers management), insertion functionalities, display and deletion through the icons
  and finally, from the «scroller parameters» area, to modify the default criterions values (and «Accept» in order to be updated):
 Responsible Persons Management

In the «Responsible persons» area, someone may select the persons to which the tasks are illustrated to the timetable in the case where the position allows viewing others tasks:
Alternative Layout
From the  icon, in available «panels» to the right, someone may create new layouts of the particular Calendar with the desired settings, thus, every time the user will “open” this area, they will be available for selection:

Timetable Print
From the horizontal toolbar, with the  button (print), someone may directly send to the printer the current timetable illustration. Alternatively, someone may use the
  option (print preview), in order to undertake some settings from the dialog toolbar, before sending it to a paper.
Attachments Management
The system manages attachments of any type (text, word, excel, image, video etc.). Someone may connect the attachments with the “company” if it is of general use, informative, procedures etc but he also connect them with particular entities that the system manages in order to be later available FROM an entity’s’ management.
 Examples
Customer contract
Published customer pricelist
Products’ bill of materials
Advertising video clip and product photos
Copy of document print (with fiscal signature) in PDF format
Tasks Note with technical details of a repair from service\
Electronic messages that were exchanged in relation to the offer
Document Connection
Through the different entities supporting documents connection, management is enhanced in the following way….
We are transferred to the sub-page « related documents ».
In an empty line, we select the document through the searchning icon of the « Position name » column.

The document type, the title, the code and the reference date are automatically completed
We may define document categorization (group, category, characteristics), as well as, whether is an incoming or outgoing document
We define whether it will be saved to the base
From the right toolbar
 , we can ask for the document opening, in order to have the management programme installed as well the saving to the local disk.
We save the entity
In the general parameters («Tools/Parameterization/General/Company Parameters») in «Documents Management» category, a number of documents settings are defined:


Documents Mass Management
In the “Management” central menu, the «Attachments» option is available. This leads to a scroller of all attachments management and control.

Here, someone may ask for attachments of particular type or these that were inserted from a particular user or to select based on the date and finally with “double click” to open the attachment of the current line.
Search In Attachments
Using Ctrl+F or through the main menu with placement to «search filed», a dialog enabling the searching of any word or phrase to different application entities, to the menu, to the documentation, and to transactions content, will open.

The suitable option for documents searching is “in database”.
We type the requested and the system detects the documents (enables document direct reading-opening) and also the entities that these documents may be connected (enabling the access to the management screen of the particular entity) and displays results to the same dialog. In the case we have a document that is connected to an entity, the results are displayed in TWO lines, one for the entity and one for the related document, in order for someone to select the one that he wishes to be transferred. If the requested (word-phrase) is also detected to fields of these particular entities (e.g. To X document of Y customer but also to the comment of Z item), then, these entities, are displayed to separate lines.
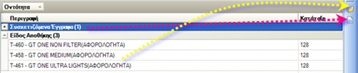


Classified Access to Documents
The concept of «classification» concerns the definition of users access privileges to the documents PER DOCUMENT (in contradiction with the not “classified” privileges, these are “horizontally” defined for the rest of the entities).
In order to use this funtionality we need to activate this operation to the related documents, through the last Privileges Menu option => Classified Privileges and from the dialogs’ Administration menu through the “classified tables” option:
Continuously, in the right top of the dialog, the company SECTIONS must be defined (in a hierarchical way) whereas at the same time the Users or the Users Groups will be matched to these sections to the right bottom part of the dialog:
One user may be added as a “separate section” from tools column of the users list.
The corresponding (matching) to sections is manually accomplished through the buttons with the arrows to the bottom part for the SELECTED SECTION in the Top part of the screen.


After this privileges classification definition profile is saved, the following functionalities, are given:
In the «Attachments» list, there is the «global classification assignment» option through which we can massively define the access to a section for the selected documents (who will be able to view the particular document):
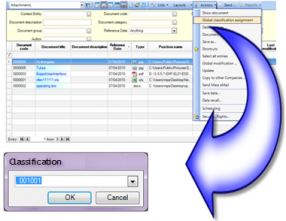
The «System Administrator» does not have special treatment as to this operation. He participates to documents classification as any other user. Thus, he should belong to the Section that he would like to provide privileges or to be “Chief” (see. Sections hierarchy).
In the «Attachments» page, during documents attachments to entities, and through the «Security classification» option, we can (AFTER activation) define in the same way, which users are going to have access to the document (Section selection):


Keyboard Operation
Many functions can be executed from the keyboard for greater convenience:
| general | |
|---|---|
| Alt-F12 | Placement to the folder containing the files of the current scroller or cube |
| Alt-F4 | Application closing |
| Ctrl - | Levels closing |
| Ctrl + | Levels developing |
| Ctrl-A | All selection to list |
| Ctrl-D | Deletion of entity from the management screen |
| Ctrl-F12 | Grid formatting tool |
| Ctrl-F6 | Shift between two open windows |
| Ctrl-Insert | Insertion of entity from list by copy from current line data |
| Ctrl-N | Insertion of new entity from management screen |
| Ctrl-PgDn & Ctrl-PgUp | Shift between “sub-pages” to entity management screen |
| Ctrl-S | Save entity |
| Ctrl-Shift-F10 | Field identity when we are placed to entity management field |
| Ctrl-Shift-F12 | Grid columns rename |
| Ctrl-Shift-F8 | Call of the design tool from entity’s’ management screen |
| Delete | Delete entity from list |
| Enter | Shift to next field (to management screen), entity opening (from list) |
| F1 & Shift-F1 | Οn line help to screen and field |
| F3 & F4 | Search with searching dialog display or in drop down format |
| F5 | Refresh |
| F7 | Spell check to text field of an entity’s management screen |
| F10 | Transfer to main menu |
| Insert | Insert new entity from list |
| Shift-F3 | Search with scroller use |
| Shift-F10 | Display of «internal» (pop-up) menu |
| Tab & Shift-Tab | Shift between fields-areas |
| to documents | |
| Alt-A | ledger entry call that was produced from document |
| Alt-E | Item Audit view display to document item line |
| Alt-Enter ή Ctrl-Enter | Dialog call with document line full data |
| Alt-F | Display of values analysis table per %VAT to trade document |
| Alt-F3 | Search from multiple code to document item line |
| Alt-F7 | Discount on the total with %, amount or modification of payable amount to the document |
| Alt-F9 | Add from Special bill of material to empty document item line |
| Alt-F12 | Call of dimensions analysis table to document item line (1-1 development) |
| Alt-Q | Apply of invoicing policy to trade document |
| Alt-S | Serial number selection to document item line |
| Alt-V | Add new document line by copy from the current |
| Ctrl-Alt-F12 | Management of items packages to document item line |
| Ctrl-Alt-I | Display of item photo to document item line |
| Ctrl-F7 | Discount with selection of net, gross, % or amount or payable) on documents lines |
| Ctrl-F9 | Item replacement from equivalent to document item line |
| Ctrl-F11 | Previous entries for the "pair"-> line item-header trade account |
| Ctrl-M | Transfer of fixed assets to cost center to fixed assets lines of documents Offset entries |
| Ctrl-Q | Allocation of total (counted) quantities to document items lines |
| Ctrl-Shift-F9 | Addition of relevant items with opposite line type based on the predetermined relation type |
| Ctrl-Y | Customer credit balance proposal to payment term line of trade document |
| F6 | Switch between stock items and payment terms in a trade document |
| F7 | Switch between stock items and special accounts in a trade document |
| F8 | Automatic "consumption" of serial numbers or lots to document item line |
| F9 | Addition of accessories items to document item line |
| F11 | Display of current availability to document item line |
| F12 | Closing of note line amount to ledger accounts in cash documents |
| F12 | Call of dimensions analysis table to document item line (1-Ν development) |
| Shift-F4 | Change of line type (for returned items) to document item line |
| Shift-F5 | Forecasts lines development of trade document based on items lines dimensions |
| Shift-F6 | Consumption lines connection with produced to offset documents lines |
| Shift-F7 | Development of special accounts lines based on items lines horizontal dimensions |
| Shift-F9 | Automatic addition of accessories items to document item line |
| Shift-F12 | Copy of dimensions analysis from previous item line |
Keyboard operation is parameterized.
Parameterization is achieved through the main menu “Tools/ Additional development tasks /Shortcuts management (shortcuts) ». Appears dialog with all available commands to the application screens that have already been corresponded to a buttons combination or can be matched, if the user needs it.
It have been constructed 2 «Keyboard profile» (the name appears to the top part of the list => EBS Default or EBS Alternative) that are selected from the general parameter to the «General-Operating» (0 or 1 respectively):

In order to change a shortcut value, the  button must be activated to the «Shortcut» column of a line. In the dialog presenting, can be defined up to 3 at the same time buttons combinations. If the SAME buttons combination has been defined to other/s command/s then, the current line has color indication and these “other” commands appear to the bottom part, to the «Relevant commands». There is no reason to worry (that something is wrongly defined) if the Relevant Commands are NOT COEXIST to the same screen/procedure eg. The entry display has been implemented as 4 commands for each documents category. If the relevant commands contain operations of the SAME screen, scroller etc the shortcut must change, in order to avoid an operational problem. With click to «Shortcut» column sorting is accomplished and errors are easier detected.
The appearing commands are divided into “Actions”, “Automations” and “Transitions”, to “Horizontal operations” and “Documents”. Are grouped per “Unit”, in the “Explanation” column, there is a helping text that explains each ones’ functionality.
I n order for any changes to be saved to the current keyboard Profile, “Save” must be selected. The profile is COMMON for ALL USERS.
